
Occurrence of apoptosis and expression of proliferative markers are powerful tools to establish a prognosis in the follow-up of cancer.
ObjectiveTo evaluate the growth fraction in papillomas and laryngeal squamous cell carcinomas with three degrees of differentiation through apoptosis and the expression of nucleolus organizer regions.
MethodsRetrospective study from which paraffin material was submitted to microtomy and hematoxylin–eosin and silver staining. Stained slides were used to quantify the apoptotic index and the number of nucleolus organizer regions by morphometry.
ResultsApoptosis was significantly more frequent in well differentiated carcinomas and in papillomas, and a higher growth fraction of expressed nucleolus organizer regions and cells that expressed a greater than average number of nucleolus organizer regions were more frequently noted in undifferentiated carcinomas.
ConclusionsThus, it was possible to verify that a high apoptotic index was associated with a lower chance of tumor differentiation in carcinomas, while a greater number of total nucleolus organizer regions, cells expressing nucleolus organizer regions above average and a higher growth fraction were associated with greater likelihood of abnormal cell proliferation and increased tumor differentiation.
A ocorrência de apoptose e a expressão de marcadores proliferativos são ferramentas poderosas no estabelecimento do prognóstico do câncer.
ObjetivoAvaliar a fração de crescimento de papilomas e carcinomas laríngeos de células escamosas, com três graus de diferenciação, através da apoptose e expressão de regiões organizadoras de nucléolo.
MétodoEstudo retrospectivo, cujo material emblocado em parafina foi submetido à microtomia e coloração em hematoxilina-eosina, e pela prata. As lâminas coradas foram utilizadas para quantificar o índice apoptótico e o número de regiões organizadoras de nucléolo (NORs) através da morfometria.
ResultadosA apoptose foi significativamente mais frequente em carcinomas bem diferenciados e em papilomas; enquanto que uma maior fração de crescimento, de NORs expressos e de células que expressaram maior número de NORs, foram mais frequentes nos carcinomas indiferenciados.
ConclusõesFoi possível verificar que o índice apoptótico elevado indica menores chances de diferenciação tumoral nos carcinomas, enquanto que um maior número de NORs totais e células expressando NORs acima da média, e uma maior fração de crescimento, determinam maiores chances de proliferação celular anormal e maior diferenciação tumoral.
Worldwide, carcinomas of the head and neck occupy the fifth position in incidence, and affect mainly male smokers and drinkers, and the regions of the larynx and oral cavity.1 It is estimated that in Brazil more than 6000 new cases of carcinoma of the larynx occurred in 2012, and worldwide it is considered the second most common tumor in the respiratory tract and the most common among cancers of the head and neck, representing 2% of all malignancies.2
Several studies have shown that the number of nucleolar organizer regions stained by silver (AgNORs) in malignant neoplastic cells is often greater than in benign tumor cells or normal cells.3,4
Rüschoff et al.5 concluded that the guided evaluation of the pattern of AgNORs facilitates the understanding of cell biology, since the number and area of points dissociated from AgNORs are mainly related to the rate of proliferation, and differ markedly among cell strains, in the various degrees of differentiation, regardless of the type and size of AgNOR aggregates in the cell. Thus, the relationship between AgNOR quantification at interphase and cell proliferation has been widely investigated in human tumors, by comparing AgNOR relative parameters at interphase with those cell proliferation markers commonly used in tumor pathology.4
Antonangelo et al.6 examined the relationship between the expression of nucleolus organizer regions stained by silver (AgNORs) and survival time in patients with squamous cell carcinoma of the lung and concluded that the expression of AgNORs was lower in tumors in their early stages, and in tumors that were of a high histological grade; a higher number of AgNORs was associated with lower survival rates. These results encouraged the use of AgNORs’ technique in the prognosis for lung cancer.
Rüschoff et al.,5 working with normal and neoplastic cells of the urinary system, showed that the size of AgNOR aggregates is related to cell differentiation, and larger AgNOR aggregates were observed in those more differentiated tumors.
Lorand-Metze and Metze,7 in an attempt to establish a correlation between the staining pattern of AgNORs in chronic lymphocytic leukemia (CLL) and tumor kinetics, concluded that the percentage of circulating lymphocytes with a cluster of AgNORs could be used as a parameter of the kinetics of this tumor, helping to differentiate patients with the disease in both stable and progressive stages, correctly classifying 94% of patients. For all practical purposes, a value of more than 13% of cells with clusters of AgNORs suggested progressive disease.
Cases of squamous cell carcinoma of the oral cavity had their prognosis predicted by quantifying the number of AgNORs, despite the occurrence of some overlapping among individual values. The mean number of AgNORs was higher for lesions with a poor prognosis and with a more aggressive character.8
Based on this, AgNORs have been widely used as markers of cell proliferation, showing good diagnostic and prognostic value in the field of tumor pathology.9–11
Recent studies have described the occurrence of apoptosis in several types of human carcinomas, the most undifferentiated tumors being those that usually present the lowest apoptotic index.12,13 Thus, the apoptosis process seems to have a close relationship with a good prognosis for patients with epithelial tumors of the larynx.
In this context, the objectives of this study were: (a) to determine the apoptotic index; (b) to determine the number of AgNORs; (c) to assess the rate of growth of malignant and benign epithelial neoplasms of the larynx.
MethodsFor this research, we conducted a study of a historical cross-sectional cohort. Samples were obtained from patients undergoing surgical treatment of laryngeal tumors during the period between the years 1989 and 2002. All material used was primarily harvested by doctors at the hospital with diagnostic and therapeutic purposes; at that time, there was no knowledge of the possibility of conducting this research. The study was conducted during the period between the years 2002–2004; at that time, we did not have norms establishing guidelines for the use of biological materials in research. Since 2005, with the Resolution 347/05, norms have been established to regulate the storage and use of human biological material in the context of research projects. Resolution 441/11 is an updated version of the Resolution 347/05, in which Article 15 maintained virtually the same provisions of the previous version. Therefore, as this study was conducted prior to this Resolution, the Ethics Committee decided these determinations were not necessary.
Initially, we undertook a survey of hospital clinical records, with the aim of identifying individuals with benign and malignant laryngeal neoplasms. One hundred and forty-two patients were found, among whom 40 were selected because the material embedded in paraffin was in better condition. We disregarded the remainder because of a high incidence of moderately differentiated carcinomas, which did not justify increasing the sample size we had already obtained and judged to be representative.
Gender, race and age were not considered as selection criteria. Thus, based solely on the histopathologic criteria, these patients were divided into groups, and their carcinomas were characterized (based on the degree of keratinization) as well differentiated (grade I – 4 cases), moderately differentiated (grade II – 16 cases) and undifferentiated (grade III – 14 cases). The patient sample included also six benign tumors that were papillomas. Well-differentiated lesions are those in which there occurs keratinization of the individual cells and the formation of multiple horny or keratin beads or pearls of varying size; there are groups of cells actively invading the connective tissue. Moderately differentiated lesions retain, in part, the characteristics of normal epithelium, but the cells already exhibit alterations in their forms. In poorly differentiated lesions the resemblance to squamous epithelium is less pronounced. The characteristic shape of the cells may be altered, as well as the typical intercellular arrangement. The cells show variation in size, staining strength and ability to perform the function of a squamous cell, which is the formation of keratin; these are different and pleomorphic cells, with loss of cohesion and showing numerous and atypical mitotic figures.
With a goal to analyze the histological grade and the apoptotic index, the samples embedded in paraffin were sectioned at 4μm and stained with hematoxylin–eosin (HE). Other sections were submitted to silver impregnation for quantification of the cell proliferation index by counting NORs. The sections were dewaxed, rehydrated sequentially in absolute alcohol, 70% and 50% and washed in deionized water. The sections were stained with Ploton et al.14 technique, modified by Aubele et al.15 The silver impregnation was performed by two previously prepared solutions: solution A (aqueous solution of silver nitrate, 50%) and solution B (formic acid 1% containing 2g of colorless gelatin). Solutions A and B were mixed at a ratio of 2:1 at the time of incubation of the sections. The incubation was performed in a wet/dark chamber at 37°C for 20min. Subsequently, the sections were washed with deionized water for 15minutes and dehydrated in 70% alcohol and absolute alcohol, diaphanized in xylene and mounted with Entelan.16
One slide from each group (papillomas, grade I, II and III carcinomas) was selected for determining the minimum number of fields to calculate the apoptotic index. In each slide, the highest number of possible fields was analyzed (using a 40× objective), to determine the apoptotic indexes, i.e., the number of apoptotic cells in the field divided by the total number of cells in the same field. The images were generated by a microscope connected to a camera and transferred to a digitizing board in the computer, where the morphometry was performed using a specific computer program (Kontron KS 300 version 2.0). To quantify apoptosis in these lesions, the minimum number of representative microscopic fields was obtained by an analysis of instability of the variation coefficient.17 Among the evaluated fields, mean values for multiple samples of five random fields were obtained, until attaining the total number of fields per slide. These mean values were considered as experimental units and used in the statistical analysis. The standard deviations (SDs) and coefficients of variation for each sample size decreased, as the number of fields considered increased, until the occurrence of stabilization. This stabilization occurred when 10 fields per slide for papillomas and 30 fields per slide for carcinomas of all degrees were obtained.
Next, one slide of each group (papillomas, grade I, II and III carcinomas) was selected; the largest possible number of fields (100× objective) was analyzed and the number of total NORs (i.e., the number clumps per nucleus in the field divided by the total number of nuclei in that same field, using the same method and equipment mentioned above) was registered. The stabilization occurred when 10 fields per slide for papillomas and 15 slides for all grades of carcinomas were achieved.
As to the analysis of the apoptotic index (number of apoptotic cells/total number of cells×100), the cells were observed by a single researcher, who counted only those cells exhibiting at least three of the following morphological characteristics peculiar to the process: (1) anoikis (presence of a pericellular clear halo); (2) cytoplasm condensation; (3) nuclear condensation (crescents); (4) nuclear fragmentation; (5) cell fragmentation (apoptotic bodies); (6) phagocytosis of apoptotic bodies (“cell cannibalism”). The areas of necrosis were excluded. The cells in apoptosis, and subsequently all the epithelial cells, were counted, in an area corresponding to 53,333.4μm2 in a total of 10 fields for papillomas and 30 fields for all grades of carcinomas.
As to the analysis of the cell proliferation index (number of NORs/total number of nuclei×100) in an area corresponding to 8.533,37μm2, he counted the NORs present in each nucleus and, in parallel, the total number of epithelial nuclei, for a total of 10 fields for papillomas and 15 for all grades of carcinomas. The ratio between the number of cells expressing AgNORs above average and the apoptotic index was regarded as the growth fraction for each tumor type.
Means or medians were obtained for the studied morphometric parameters, in order to characterize the groups. At first, the normality of the data through the Kolmogorov–Smirnov test was verified. When the distribution was normal, we used the Student's t test (a parametric test) to compare the means of different injuries. When the distribution of the data did not show normality, we used the nonparametric Mann–Whitney test to compare the medians of different injuries. All data were analyzed with a significance level of 0.05 with the GraphPad Prism 3.0 software.
ResultsOf the 40 selected samples, 34 were from patients with laryngeal carcinoma, 28 men (82.35%) and 6 women (17.65%) with a mean age of 59.5 years. The laryngeal papilloma cases consisted of 4 men (66.66%) and 2 women (33.34%) with a mean age of 36 years.
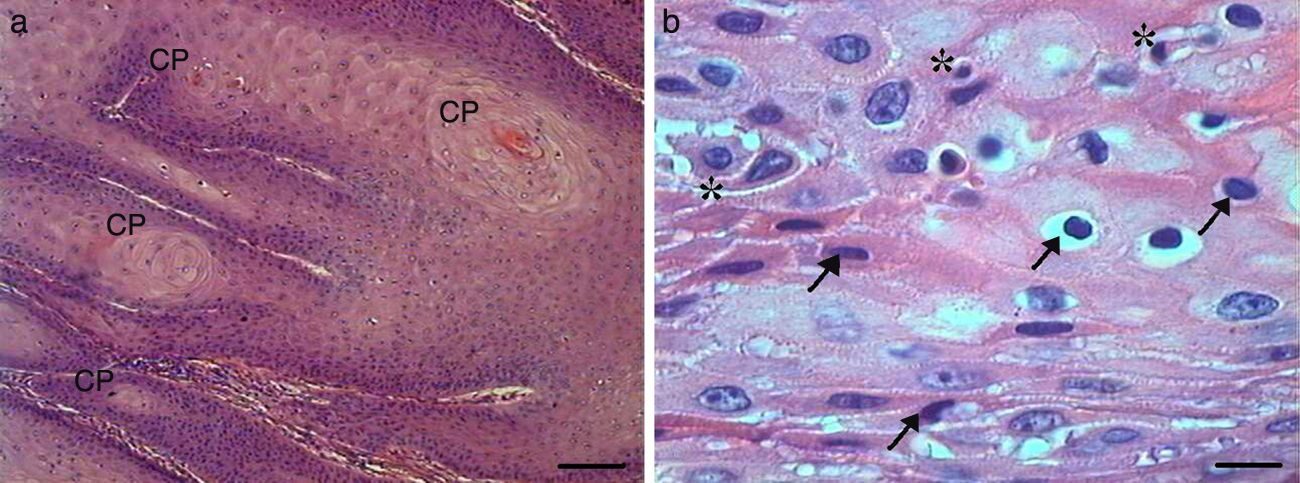
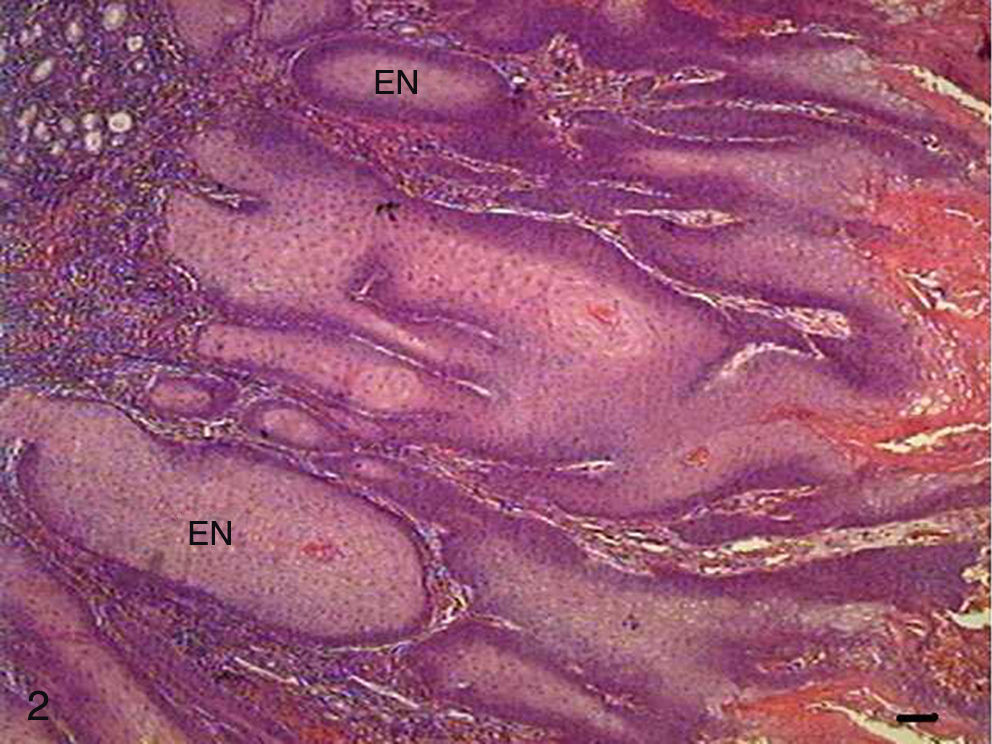
Histologically, we observed in the samples with Grade I squamous cell carcinoma (SCC) a variable number of keratin pearls scattered throughout the tissue (Fig. 1A), as well as isolated intracellular keratinization. We also noted numerous cells in apoptosis scattered through the tumor displaying condensation of the cytoplasm and anoikis (Fig. 1B). The cellular pleomorphism varied between mild and moderate, and the nuclear size showed little variability. Although an invasion of adjacent tissue by tumor cells was noted, the edges of the epithelial strands and nests were well defined (Fig. 2).
 Micrograph of grade I squamous carcinoma cells, with the presence of diffuse keratin pearls (CP) (HE, bar=100μm). (B) Micrograph of grade I squamous carcinoma cells with various apoptotic cells with condensation of cytoplasm (arrows) and anoikis (*) (HE, bar=10μm).")
Grade I squamous cell carcinoma (A) Micrograph of grade I squamous carcinoma cells, with the presence of diffuse keratin pearls (CP) (HE, bar=100μm). (B) Micrograph of grade I squamous carcinoma cells with various apoptotic cells with condensation of cytoplasm (arrows) and anoikis (*) (HE, bar=10μm).
 (HE, bar=100μm).")
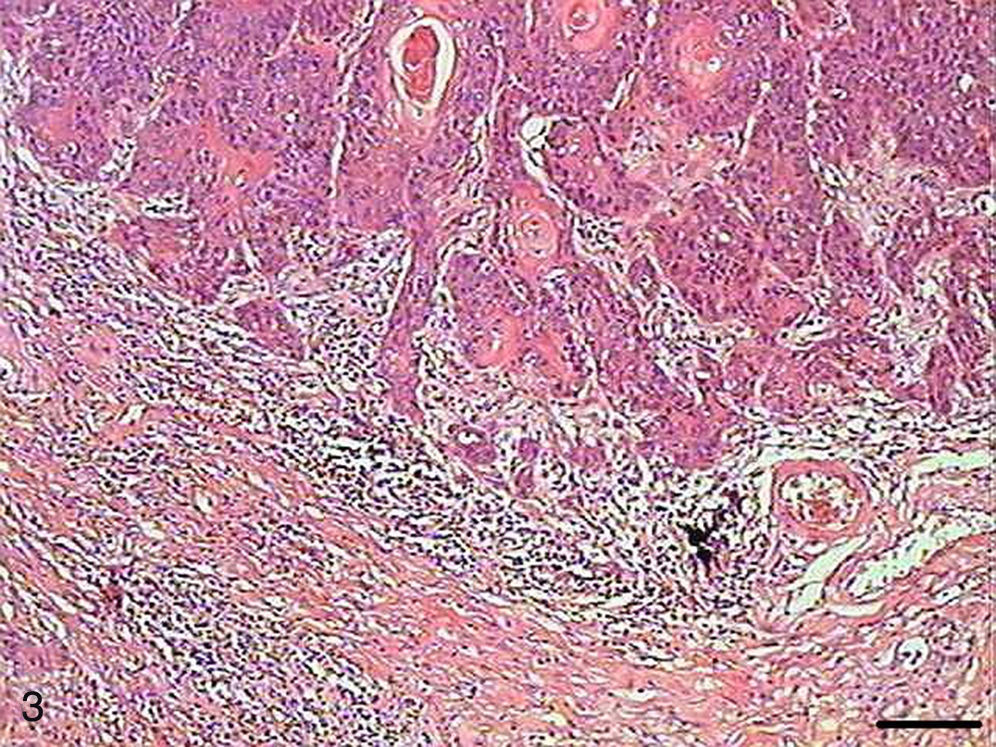
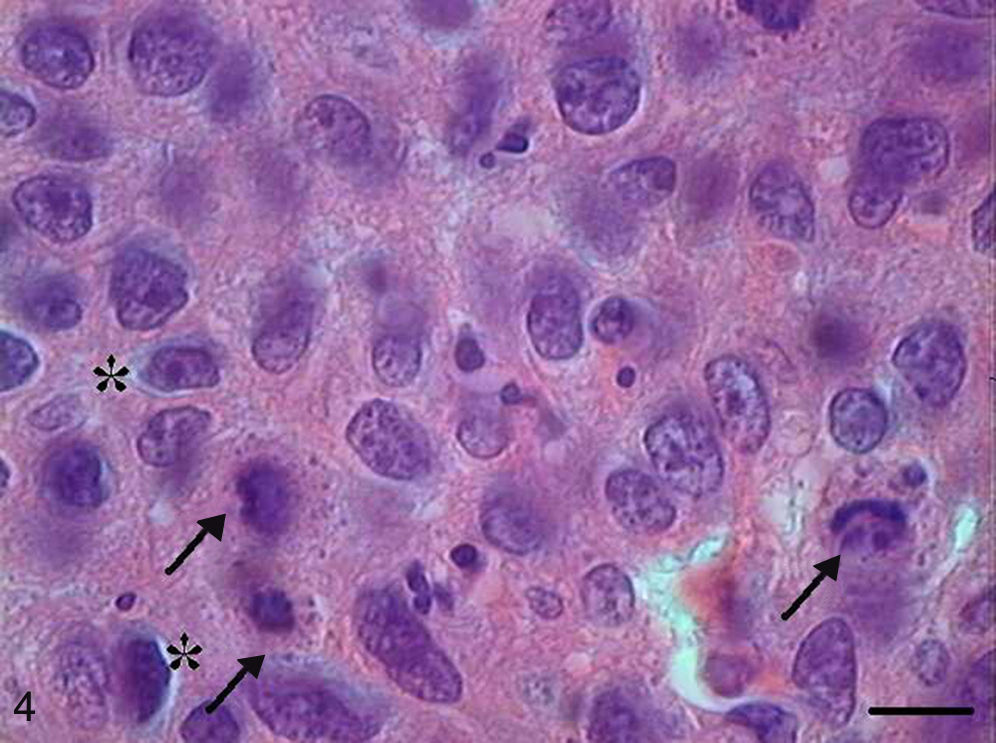
In Grade II SCC (SCC II), we observed fewer keratin pearls and a greater connective tissue invasion by tumor cells (Fig. 3). Mitoses were frequent, many of them atypical. Apoptotic cells with condensation of cytoplasm and anoikis (Fig. 4) were present throughout the tumor tissue, but to a lesser extent than in Grade I SCC (SCC I).
.")
 and anoikis (*) (HE, bar=10μm).")
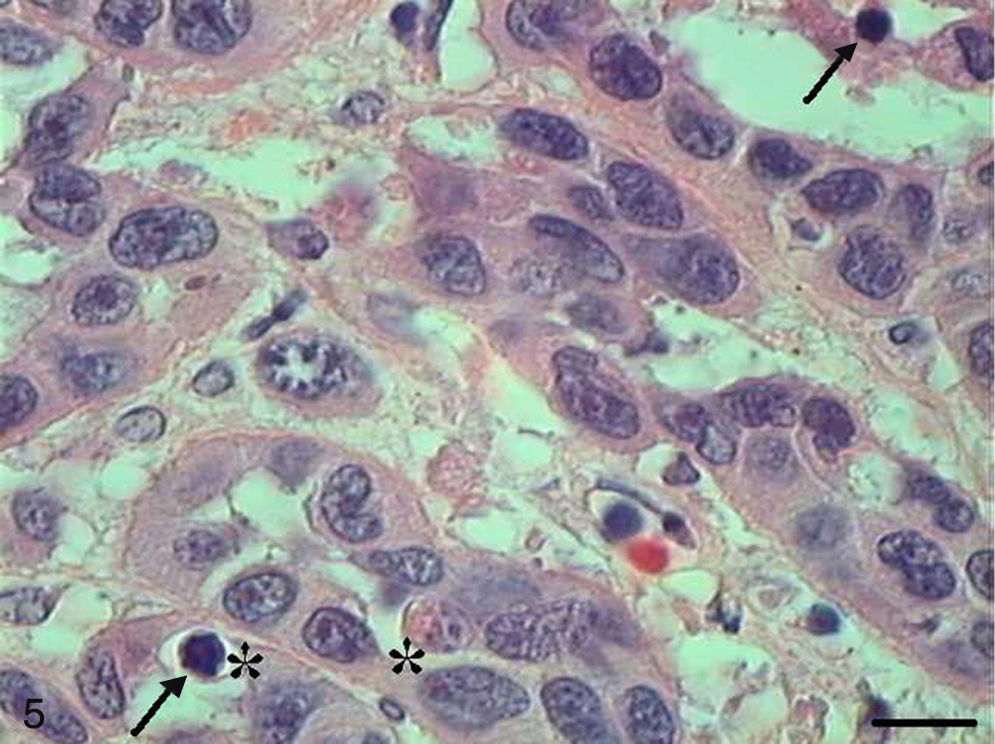
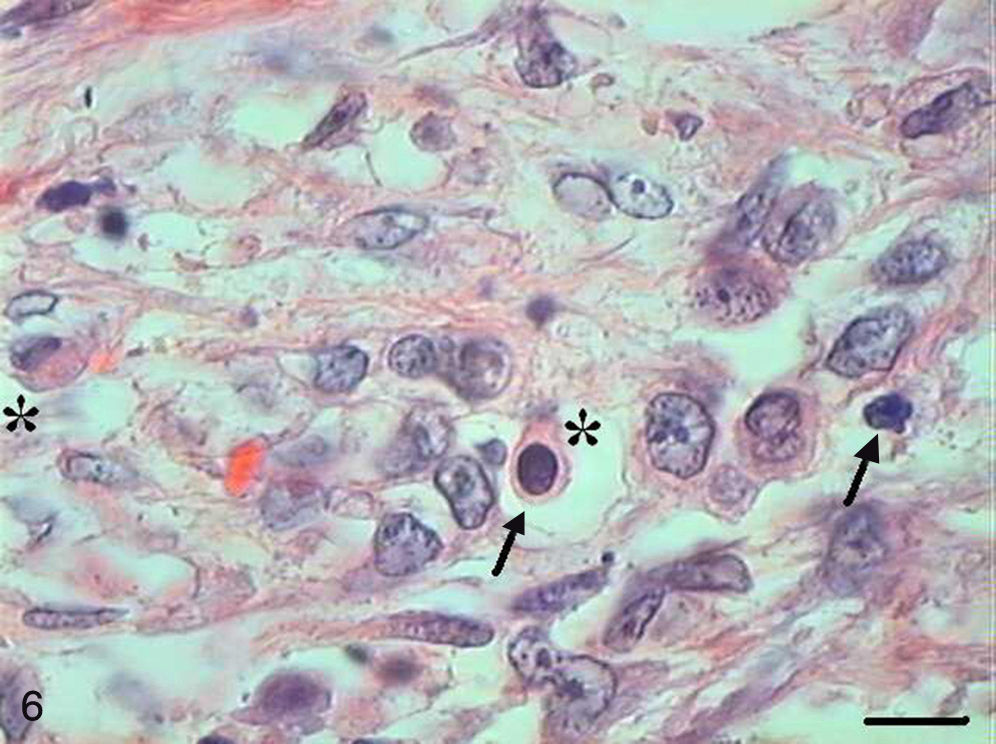
In Grade III SCC (SCC III), pleomorphism and atypical cells were more dominant, the nuclei were seen to be increased in size, and there was nuclear hyperchromatacism and an increased nucleus/cytoplasm ratio (Fig. 5). The cells showed loss of cohesion, with invasion through the connective tissue and also through deeper areas, such as muscle and glandular tissues. Virtually no cell with intracellular keratinization was observed, and there were no keratin pearls. Few cells were in apoptosis, and the condensation of the cytoplasm and anoikis (Fig. 6) occurred without a definite pattern of location and also in isolated epithelial cells present in the stroma.
 (HE, bar=10μm).")
 and anoikis (*) (HE, bar=10μm).")
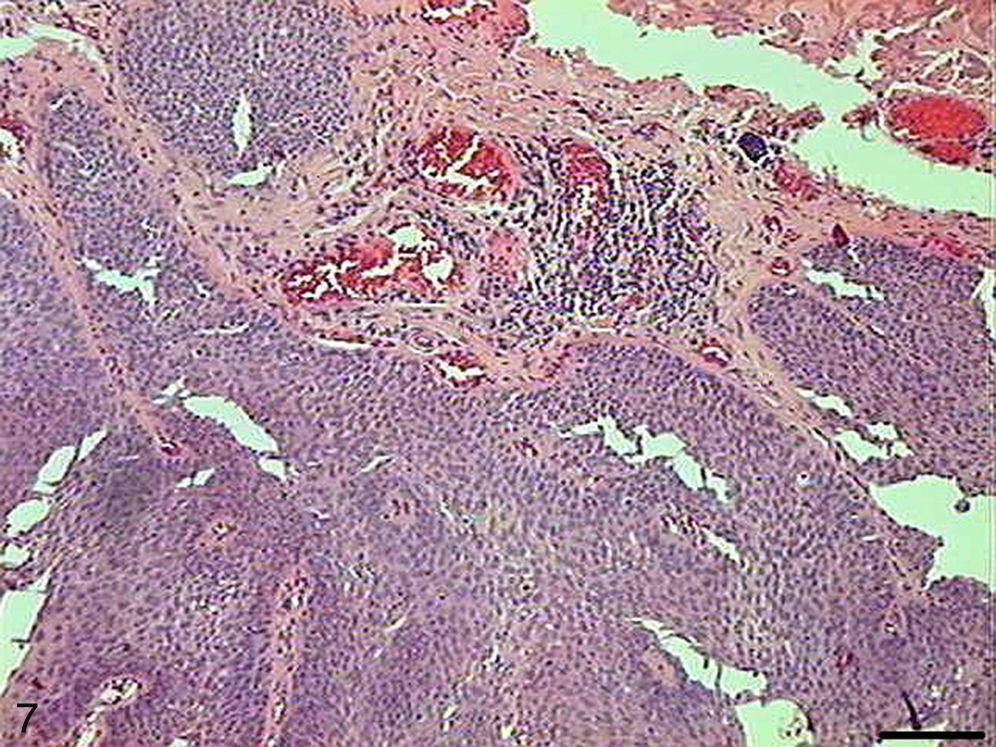
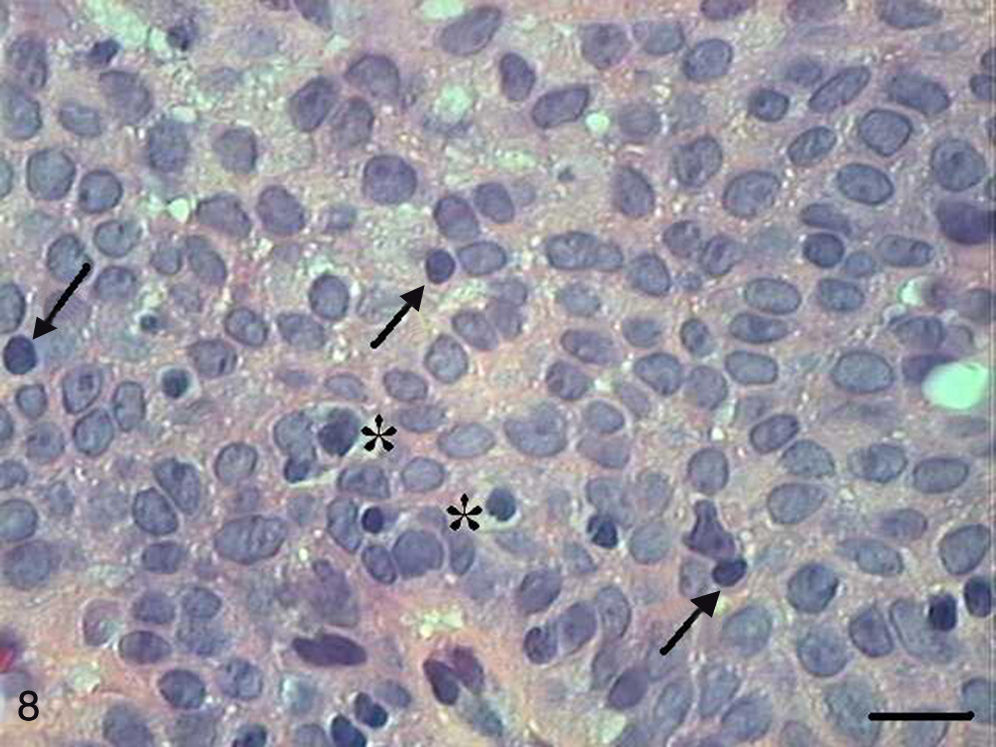
The papilloma presented exophytic projections (Fig. 7). Each projection was covered by keratinized squamous epithelium with hyperkeratosis and with cells supported by a central part of connective tissue with blood vessels. Furthermore, we observed cells undergoing apoptosis with cytoplasmic condensation and anoikis in the papilloma's finger-like projections (Fig. 8). The apoptotic cells were distributed most frequently in the basal and spinous layers.
.")
 and anoikis (*) (HE, bar=10μm).")
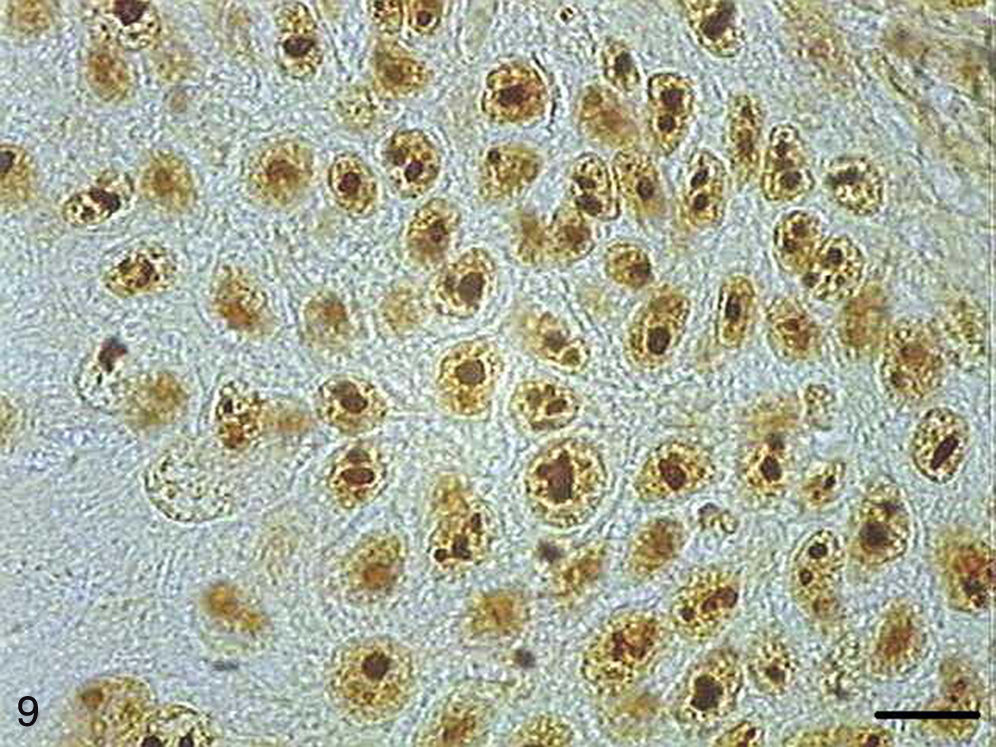
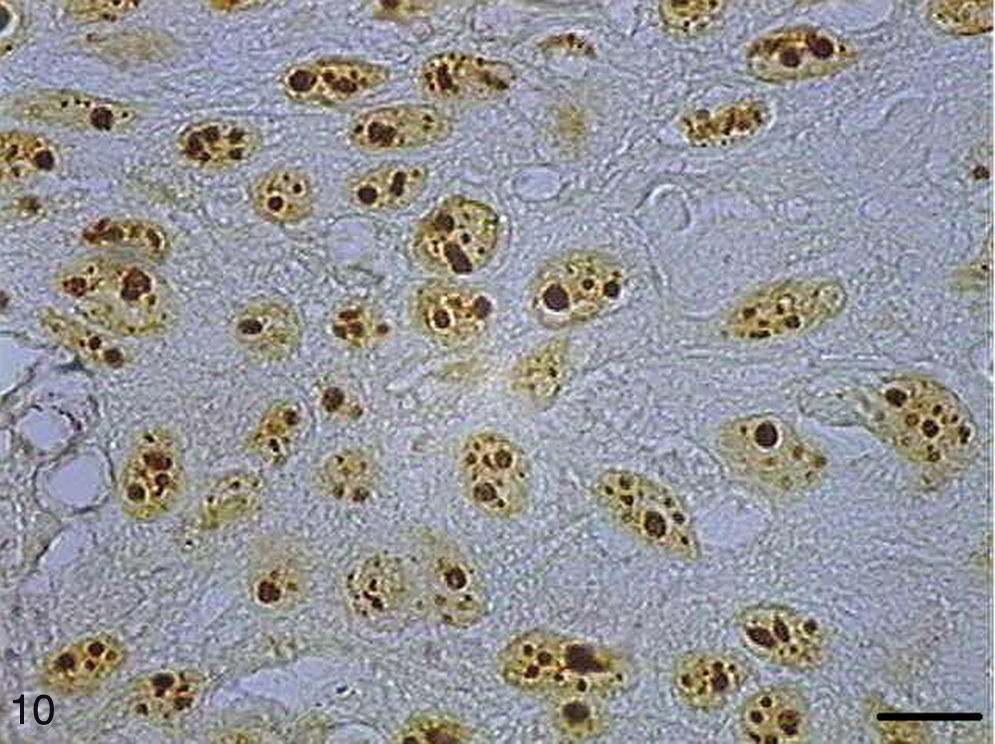
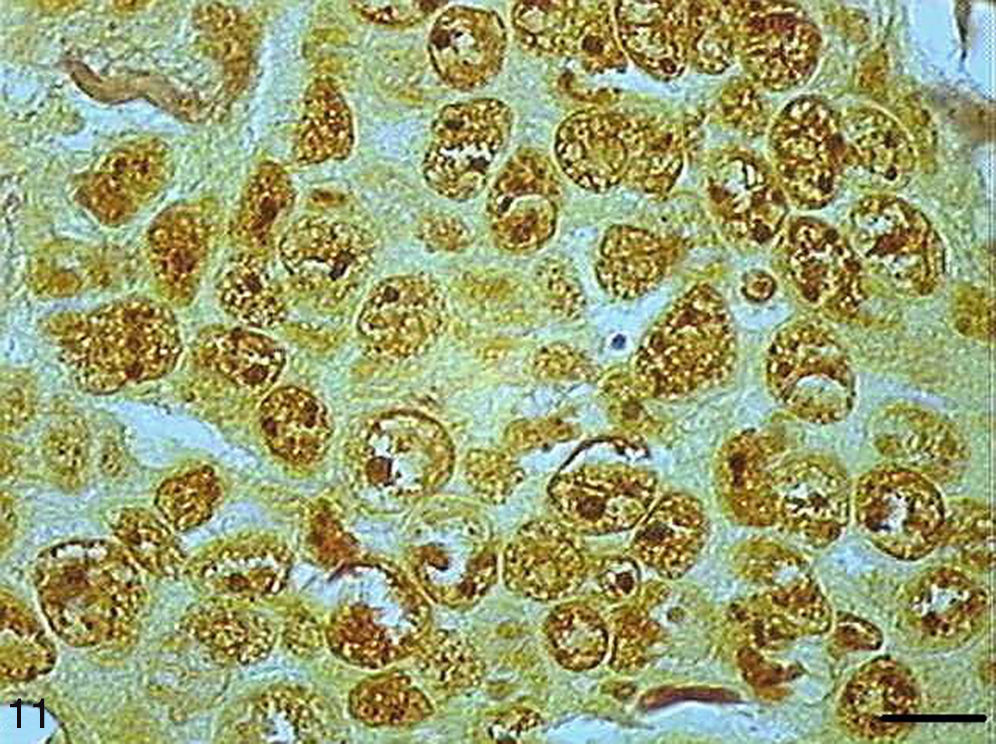
AgNORs were identified in many tumor types in the form of brownish or black clumps with varied shape, size and distribution. In SCC I, AgNORs presented as isolated clumps or formed clusters with rounded or irregular shapes, filling the entire nucleolus or scattered in the nucleus like satellites (Fig. 9). In SCC II, we noted the presence of AgNORs forming rounded clumps, filling the entire nucleolus, or as small satellites scattered throughout the nucleus (Fig. 10). On the other hand, in SCC III, the AgNORs formed dark, irregular adjoining clumps occupying virtually the entire nucleolus, or were isolated in the form of satellites in large nuclei (Fig. 11).
.")
Grade I squamous carcinoma cells with AgNORs. Micrograph of grade I squamous carcinoma cells with AgNORs in the form of isolated lumps or forming large aggregates, with rounded or irregular shapes filling the entire nucleus or present in the nucleolus as satellites (AgNOR, bar=10μm).
.")
.")
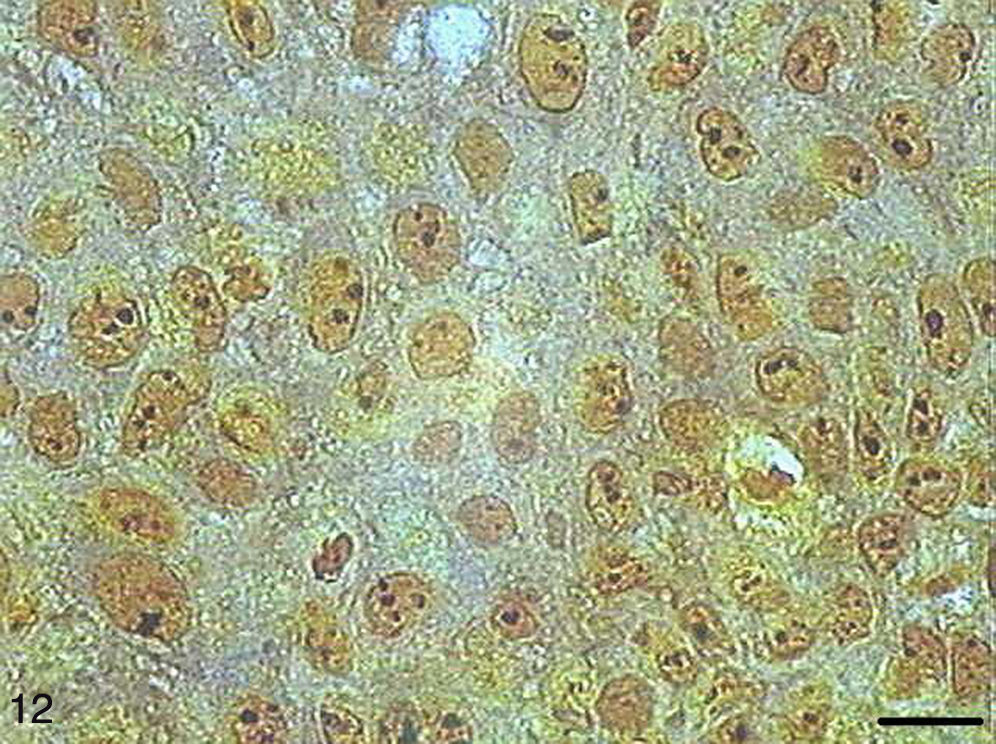
In the papilloma samples, AgNORs exhibited a distribution similar to that found in SCC I samples, forming small, isolated clumps or as clusters, present as satellites in the nucleus or occupying the entire nucleolus (Fig. 12).
.")
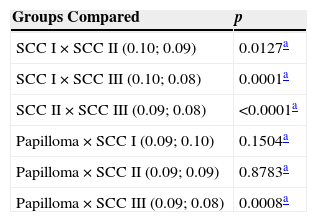
With respect to the apoptotic index, SCC I showed a higher value when compared with SCC II (p=0.0127) and III (p<0.0001), but not compared papilloma (p=0.1504). SCC II showed a higher apoptotic index when compared with SCC III (p<0.0001), but with no significant difference in relation to papilloma (p=0.8783). Finally, SCC III, when compared with papilloma, showed a lower apoptotic index (p=0.0008) (Table 1).
Medians of apoptotic indexes.
| Groups Compared | p |
|---|---|
| SCC I×SCC II (0.10; 0.09) | 0.0127a |
| SCC I×SCC III (0.10; 0.08) | 0.0001a |
| SCC II×SCC III (0.09; 0.08) | <0.0001a |
| Papilloma×SCC I (0.09; 0.10) | 0.1504a |
| Papilloma×SCC II (0.09; 0.09) | 0.8783a |
| Papilloma×SCC III (0.09; 0.08) | 0.0008a |
SCC, squamous cell carcinoma.
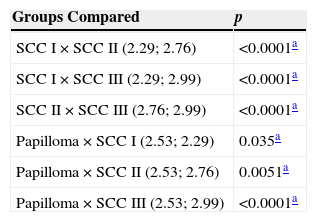
In papilloma samples, the total number of AgNORs per field was significantly higher compared to SCC I (p=0.035) and significantly lower compared to SCC II (p=0.0051) and SCC III (p<0.0001). SCC I had a lower number of total AgNORs per field compared with SCC II (p<0.0001) and III (p<0.0001). Likewise, SCC II showed a lower mean of total AgNORs per field compared to SCC III (p<0.0001) (Table 2).
Means of total number of AgNORs.
| Groups Compared | p |
|---|---|
| SCC I×SCC II (2.29; 2.76) | <0.0001a |
| SCC I×SCC III (2.29; 2.99) | <0.0001a |
| SCC II×SCC III (2.76; 2.99) | <0.0001a |
| Papilloma×SCC I (2.53; 2.29) | 0.035a |
| Papilloma×SCC II (2.53; 2.76) | 0.0051a |
| Papilloma×SCC III (2.53; 2.99) | <0.0001a |
SCC, squamous cell carcinoma.
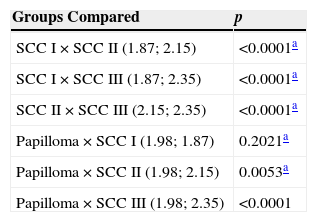
Table 3 shows comparisons of the number of cells expressing above average AgNORs per field among the different groups of tumors. There was no significant difference between papilloma and SCC I (p=0.2021) groups. The number of cells expressing above average AgNORs in papilloma group was lower than in SCC II (p=0.0053) and III (p<0.0001). SCC I showed a lower number of cells expressing above average AgNORs versus SCC II (p<0.0001) and III (p<0.0001). Likewise, SCC II showed a lower number of cells expressing AgNORs above average versus SCC III (p<0.0001).
Number of cells with AgNORs above average.
| Groups Compared | p |
|---|---|
| SCC I×SCC II (1.87; 2.15) | <0.0001a |
| SCC I×SCC III (1.87; 2.35) | <0.0001a |
| SCC II×SCC III (2.15; 2.35) | <0.0001a |
| Papilloma×SCC I (1.98; 1.87) | 0.2021a |
| Papilloma×SCC II (1.98; 2.15) | 0.0053a |
| Papilloma×SCC III (1.98; 2.35) | <0.0001 |
SCC, squamous cell carcinoma.
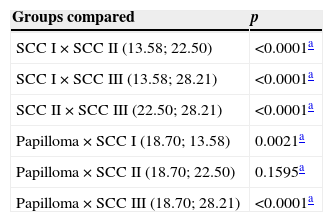
Table 4 shows comparisons of growth fractions (number of cells expressing AgNORs above average per field/apoptotic indexes) among different tumor types. SCC III had a higher growth fraction when compared with other types of tumors (p<0.0001). SCC II had a higher growth fraction versus SCC I (p<0.0001), but with no significant difference versus papilloma (p=0.1595). Papilloma group had a higher growth fraction when compared with SCC I (p=0.0021).
Medians of growth fractions.
| Groups compared | p |
|---|---|
| SCC I×SCC II (13.58; 22.50) | <0.0001a |
| SCC I×SCC III (13.58; 28.21) | <0.0001a |
| SCC II×SCC III (22.50; 28.21) | <0.0001a |
| Papilloma×SCC I (18.70; 13.58) | 0.0021a |
| Papilloma×SCC II (18.70; 22.50) | 0.1595a |
| Papilloma×SCC III (18.70; 28.21) | <0.0001a |
SCC, squamous cell carcinoma.
In malignant tumors, the cell mass can be reduced through apoptosis and necrosis; therefore, an interruption or disruption of the apoptotic pathway will facilitate the development of these tumors.18 Apoptosis is the only form of cell death found in all stages of tumor growth, which could explain satisfactorily the large cell loss rate that occurs in neoplasia.19 In rapidly growing tumors, it was observed that apoptosis and mitosis are numerically increased. Cotter et al.20 observed that in untreated tumors, the proportion of mitotic cells to apoptotic cells is close to 1:1. In the present study, the apoptotic index for SCC I reached the highest value. This fact could explain the less aggressive behavior and a lower rate of growth of this tumor. Even taking into account that the papilloma group showed a numerically lower value than SCC I, there was no significant difference between these groups. Therefore, SCC I and papilloma groups showed similar apoptotic indexes. The literature reports that many benign tumors have a low apoptotic index.21 Such result was shown in our study, in the case of papilloma. On the other hand, in SCC III this index was also low. We can assume that this finding would be a factor contributing to an increased malignancy and a trend for metastasis and for greater chances of tumor growth observed in this type of tumor. Our results were similar to those from the study by Hamada et al.22; these authors found that in SCCs of the esophagus the degrees “well differentiated” and “moderately differentiated” showed high apoptotic indexes compared to tumors with “poorly differentiated” grade, suggesting that apoptosis contributes to a good prognosis. Moreover, other authors have observed in advanced-stage tumors located in the supraglottic region that the high apoptotic index was significantly associated with poor survival, and suggested that, in the future, the presence of a high degree of apoptosis could be used to identify patients with a poor prognosis for laryngeal cancer.23 Likewise, Alcaide et al.24 reported the occurrence of high numbers of apoptotic cells in colorectal carcinomas, when compared to adenomas and to normal epithelium; the apoptotic index was also higher in metastatic disease (stage 4), when compared to other stages. This assertion is not supported by the findings of this study, because here the high apoptotic index was related to a lower histological grade and a better prognosis.
With respect to the total number of AgNORs per field, the SCC I group showed the lowest value, followed by papilloma, Grade II and SCC III groups. We observed the same with respect to the number of cells expressing above average AgNORs per field. Some studies have shown that the number of AgNORs in malignant neoplastic cells is often greater than in benign neoplastic cells, or in normal cells.10,25–27 In many tumors, the quantification and distribution of AgNORs in the nucleus and nucleolus have shown significant prognostic value.28 Some authors found that tumors with high malignancy have a higher number of AgNORs compared to low-grade tumors, which agrees with the findings of this study.28–30
Previous studies have reported that the average of AgNORs in SCCs of the oral cavity and larynx is higher in tumors with a poor prognosis and with more aggressive characteristics, i.e., poorly differentiated lesions.28,31 Hanemann, Miyazawa and Souza28 stated that the method of counting AgNORs is a useful diagnostic tool for identifying different types of oral squamous malignancies and is also a prognostic marker of these carcinomas. Furthermore, this counting helps to differentiate among pre-cancerous, benign and malignant lesions. According to Underwood and Giri,32 AgNORs scatter throughout the nucleus in varying lengths, making their measurement easy. Thus, the quantification of AgNORs is dependent on the degree of dispersion or breakdown of a large relative number of NORs in the nucleus. Therefore, the so-called histologic counting of NORs – both in benign and malignant lesions – does not result in an absolute number, but rather, in a numerical index of their dispersion. This does not impair or necessarily invalidate the usefulness of this counting technique as a discriminant factor for malignancy or transcriptional activity.
As regards to growth fraction, SCC I showed the lowest value, followed by papilloma, SCC II and SCC III. Considering that SCC I presented the highest apoptotic index and the lowest number of AgNORs above average, its growth fraction was the lowest among malignant tumors. The papilloma group showed a slightly higher growth fraction versus SCC I, and was slightly smaller than SCC II. However, these differences were not statistically significant. On the other hand, SCC III showed an extremely high growth fraction, since its apoptotic index was low and the number of above average AgNORs was high. Liu et al.33 have supported our findings, and stated that the degree of differentiation in human cancers generally reflects the degree of malignancy, where the most undifferentiated lesion is the most aggressive, based on an analysis of ovarian carcinomas. These authors suggest that microRNAs are deregulated and therefore overexpressed in these tumors, causing an increase in the rate of cell proliferation.
Karki et al.34 found irregularly shaped AgNORs in malignant cells of pleural and peritoneal effusions, and large and individual AgNORs in benign cells of the same effusions. Arora et al.35 showed that apparently the number of AgNORs per nucleus in patients with SCC of the larynx increases as the degree of tumor dedifferentiation increases. Furthermore, with a higher tumor grade, NORs decrease in size and become more irregular. In our study, the presence of larger, rounded, regular and less scattered aggregates was noted in the nuclei of SCC I, and smaller and irregular aggregates were observed in SCC III. Therefore, our findings are similar to those described for cancers of the larynx35 and for cells of pleural and peritoneal effusions.34
ConclusionsThe high apoptotic index indicates lower chances of tumor differentiation in cases of squamous cell carcinomas of the larynx.
The greater the number of total AgNORs and above average AgNOR-expressing cells, the higher the chances of an abnormal cell proliferation and the less differentiated the tumor tends to be.
The higher the growth fraction, defined as the ratio between the number of AgNOR-expressing cells above average and the apoptotic index, the higher the chances of the tumor being of a less differentiated type.
FundingThis study was supported by FAPEMIG which offered financial support for the realization of this project.
Conflicts of interestThe authors declare no conflicts of interest.
Please cite this article as: Ribeiro CV, Vasconcelos AC, Andrade Filho JS. Apoptosis and expression of argyrophilic nucleolus organizer regions in epithelial neoplasms of the larynx. Braz J Otorhinolaryngol. 2015;81:158–66.
Institution: This project was developed at the Instituto de Ciências Biológicas (ICB), Universidade Federal de Minas Gerais (UFMG); and Escola de Medicina, Universidade Federal de Minas Gerais (UFMG), Belo Horizonte, MG, Brazil.
Case report: a retrospective study of 40 cases of epithelial neoplasms of the larynx, with 3 degrees of tumor differentiation.
gology is pleased to honor the reviewers


