
The end point of treatment in skull base osteomyelitis is a matter of debate. A treatment based on symptoms alone is fraught with recurrence. There is a need to restrict imaging though more informative. The inflammatory markers like C-reactive protein and erythrocyte sedimentation rate used commonly need a detailed evaluation to optimize its utility.
ObjectivesTo compare the diagnostic accuracy of inflammatory markers with a hybrid PET scan in monitoring skull base osteomyelitis. The secondary objective was to obtain a cut-off value of these markers to decide upon antibiotic termination.
MethodsA prospective cohort study was conducted in a tertiary care center with fifty-one patients with skull base osteomyelitis meeting eligibility criteria. Patients diagnosed with skull base osteomyelitis were serially monitored with weekly markers and PET scan after the initiation of treatment. A hybrid scan was taken at 6–8 weeks of treatment and repeated if required. The follow-up period varied from 6 weeks to 15 months. The outcome measures studied were the values of markers and the metabolic activity of PET scan when the patient became asymptomatic and when disease-free.
ResultsC-reactive protein and erythrocyte sedimentation rate had a statistically significant correlation to disease activity in PET tomography scan as a prognostic marker. Both showed good clinical correlation. A cut off value of ≤ 3.6mg/L for C-reactive protein and ≤ 35mm/hour for erythrocyte sedimentation rate were taken as normalized values.
ConclusionA consistent normalized value of C-reactive protein and erythrocyte sedimentation rate for 8–12 weeks in an asymptomatic patient may be an indicator of disease control, though not cure. So, relying solely on markers alone for antibiotic termination may cause relapse. It may be used cautiously in a peripheral setting without access to more specific hybrid scans. In a tertiary care, follow-up scans may be done based on the titres, thereby limiting the radiation exposure.
Skull base osteomyelitis (SBO), popularly known as malignant otitis externa (MOE) or necrotizing external otitis is a potentially fatal osteomyelitis of the skull base frequently affecting elderly diabetics.1,2 The associated mortality which formerly was as high as 50%, has been significantly reduced in recent times with better antibiotic regimens and glycemic control. Though predominantly aural in presentation, central or atypical skull base osteomyelitis are also being reported.3–6
The diagnosis of SBO is mainly based on clinical features, culture, radiology, and histology.2 Levenson’s diagnostic criteria includes refractory otitis externa, severe nocturnal otalgia and purulent otorrhea associated with Pseudomonas infection and presence of granulation tissue in an immunocompromised or diabetic patient.7–9 It is a well-known fact that erythrocyte sedimentation rate (ESR) and c-reactive protein (CRP) are elevated in SOB.10,11 There are no guidelines for effective application of these markers to treat MOE. These values tend to be above the normal range even when patients become asymptomatic. Newer hybrid scans like FDG–PET CT and MRI are specific tools in the diagnosis and followup of SOB.12 Other techniques have various drawbacks in diagnosing and monitoring SBO. High resolution contrast enhanced CT detects bone erosion when there is demineralization of 30% or greater. MRI, though good at soft tissue differentiation and detecting bone marrow edema, cannot assess response and resolution of disease.13 Nuclear imaging modalities like technetium and gallium scan are good diagnostic tools, though poor spatial resolution is a drawback.12,14 Tc-99 scan detects even a 10% rise in osteoblastic activity and hence detects osteomyelitis early. This is cheap and easily available. However, it shows positivity in conditions with a high bone turnover, as in the postoperative state or malignancy with bone involvement. It lags with clinical improvement, therefore, it cannot be adequately used in followup of treatment response. Gallium 67 citrate shows normalization with treatment response and hence used in treatment response monitoring. High cost and high radiation dose are drawbacks. Both these gamma tracers have low spatial resolution and lack anatomical detail. This is improved by beta emitters such as FDG.
The crux of treatment is systemic antibiotics for variable duration till symptoms abate.2 The clinician is in a dilemma over the antibiotic choice, frequent switches and termination. Combination drug therapy along with cost of imaging modalities for diagnosis and followup take a financial toll on the patients.
ObjectivesThe primary objective of the study was to compare the diagnostic accuracy of CRP and ESR as prognostic factors in SBO when compared with 18-FDG−PET CT scan. The secondary objective was to achieve a numerical value for these markers as decision factors in antibiotic cessation.
MethodsThe study protocol was reviewed and approved by the Institutional Ethics Committee of our institute (IRB-AIMS 2018−029). It was in accordance with the ethical standards laid down in the Declaration of Helsinki. All interventions and investigations were done with informed consent of the patient. A prospective cross-sectional diagnostic accuracy study was conducted for 24 months at a tertiary care center with an annual ENT outpatient load of approximately 30,000. Due to lack of similar studies a pilot study was conducted on 20 patients and the observations were used to design the present study. There was a total of 70 patients initially but some defaulted on followup. Finally, 51 patients were available for analysis.
Monitoring of CRP and ESR: SBO was diagnosed in patients with a history of refractory otitis externa, immunocompromised status, histopathology of granulation tissue if available, radiology and raised titres of ESR and CRP. Central SBO was diagnosed mainly with imaging and raised titers. In appropriate cases, workup was done to rule out other inflammatory conditions such as tuberculosis and collagen vascular disorders. Markers were monitored on a weekly basis for 6–8 weeks of treatment. The institutional normal range of CRP was 0−1mg/L and that of ESR was 8−20mm/hour. If the patient continued to be symptomatic (pain and ear discharge) at the end of 6–8 weeks, the markers were monitored monthly.
PET CT procedure: PET scan was generally done for all patients at the initiation and end of 6th to 8th week of treatment. For patients who reported with either CT or MRI taken elsewhere an additional diagnostic PET was not insisted upon, although all underwent PET at 6–8 weeks. GE Discovery PET CT machine performed the 18-FDG−PET CT. Patient was kept fasting for 4h prior to the procedure and imaged by an integrated PET/CT camera, 45min after injection of F-18 FDG (0.1mCi×weight in Kg). An SUV (standardized uptake value) of 2.5 was taken as a cut-off to differentiate between malignancy and SBO. Values below 2.5 were considered inflammatory.15 A morning blood glucose level between 80 and 150mg/dL was taken as a safe range for scanning. The report was given by a dedicated nuclear imaging specialist with special interest in this area. After an imaging at 6–8 weeks of treatment, repeat scan was performed every third month till it became metabolically inactive or earlier if the markers became normal or the patient asymtomatic. Additional CT or MRI was performed only if there were fresh symptoms.
Culture and antibiotics: Aural discharge or tissue sampling from granulations were cultured at the initial visit. While awaiting cultures patients were empirically started either on intravenous (IV) Ceftazidime (2g per dose 12thhourly) or Piperacillin-Tazobactum (4.5g 8thhourly) combined with IV or oral Ciprofloxacin (IV−400 milligrams [mg] 12thhourly, oral 750mg 12thhourly). If patient continued to be symptomatic after two weeks of initiation of antimicrobial therapy, deep tissue sampling was considered. Sampling sites included mastoid, clivus, greater wing of sphenoid, mandibular condyle, carotid canal, jugular foramen, eustachian tube and tympanic ring. Samples were routinely sent for histopathological examination and cultured for fungus, bacteria, and acid-fast bacillus. In those already on multidrug therapy a DNA-PCR with gene sequencing was done to improve the yield. When feasible a debridement with an aim to disease clearance without causing further morbidity was attempted during deep tissue sampling.
Antibiotics were given through a PICC line (peripherally inserted central catheter) for a minimum of 6–8 weeks duration. Treatment was generally stopped when PET became normal. If the patient remained symptomatic while on antibiotics and cultures were negative, antifungal medications were started. Empirical antifungal treatment was also given to patients who did not undergo deep tissue sampling. IV Voriconazole at a loading dose of 6mg/kg 12thhourly for 2 doses followed by intravenous at 3mg/kg or oral 200mg 12thhourly as maintenance dose was given.
Statistical analysis was done using IBM SPSS statistics. Variables studies were the values of CRP, ESR, activity of PET scan and the symptoms of the patient during the treatment. To compare CRP and ESR with PET CT scan Mc Nemar Chi-square test was applied. Diagnostic validity parameters-sensitivity, specificity, negative, positive predictive values, and accuracy of CRP and ESR with respect to FDG−PET CT scan was calculated. An alpha level of less than or equal to 0.05 (p-value) was considered statistically significant.
ResultsOut of the 51 patients, 27 patients had central SBO. The youngest was 45 years and oldest 88 years old. Demographic profile is given in Table 1. Pseudomonas Aeruginosa (21.6) was the commonest organism followed by Aspergillus species (11.8). Polymicrobial or no growth group accounted for 31.4%. Twenty-eight (54.9 %) patients underwent debridement.
Profile of the study population.
| n=51 | Percentage (%) | |
|---|---|---|
| Gender | ||
| Female | 12 | 23.5 |
| Male | 39 | 76.5 |
| Diabetes mellitus | 48 | 94.1 |
| Microbial flora | ||
| Pseudomonas aeruginosa | 11 | 21.6 |
| Aspergillus species | 6 | 11.8 |
| Candida species | 5 | 9.8 |
| Staphylococcus aureus | 2 | 3.9 |
| No cultures/polymicrobial growth | 16 | 31.4 |
| Debridement | 28 | 54.9 |
Table 1 showing male predominance (76.5%) and high association with diabetes (94.1%), Pseudomonas (21.6%) followed by Aspergillus (11.8%) and Candida (9.8%) were the main organisms.
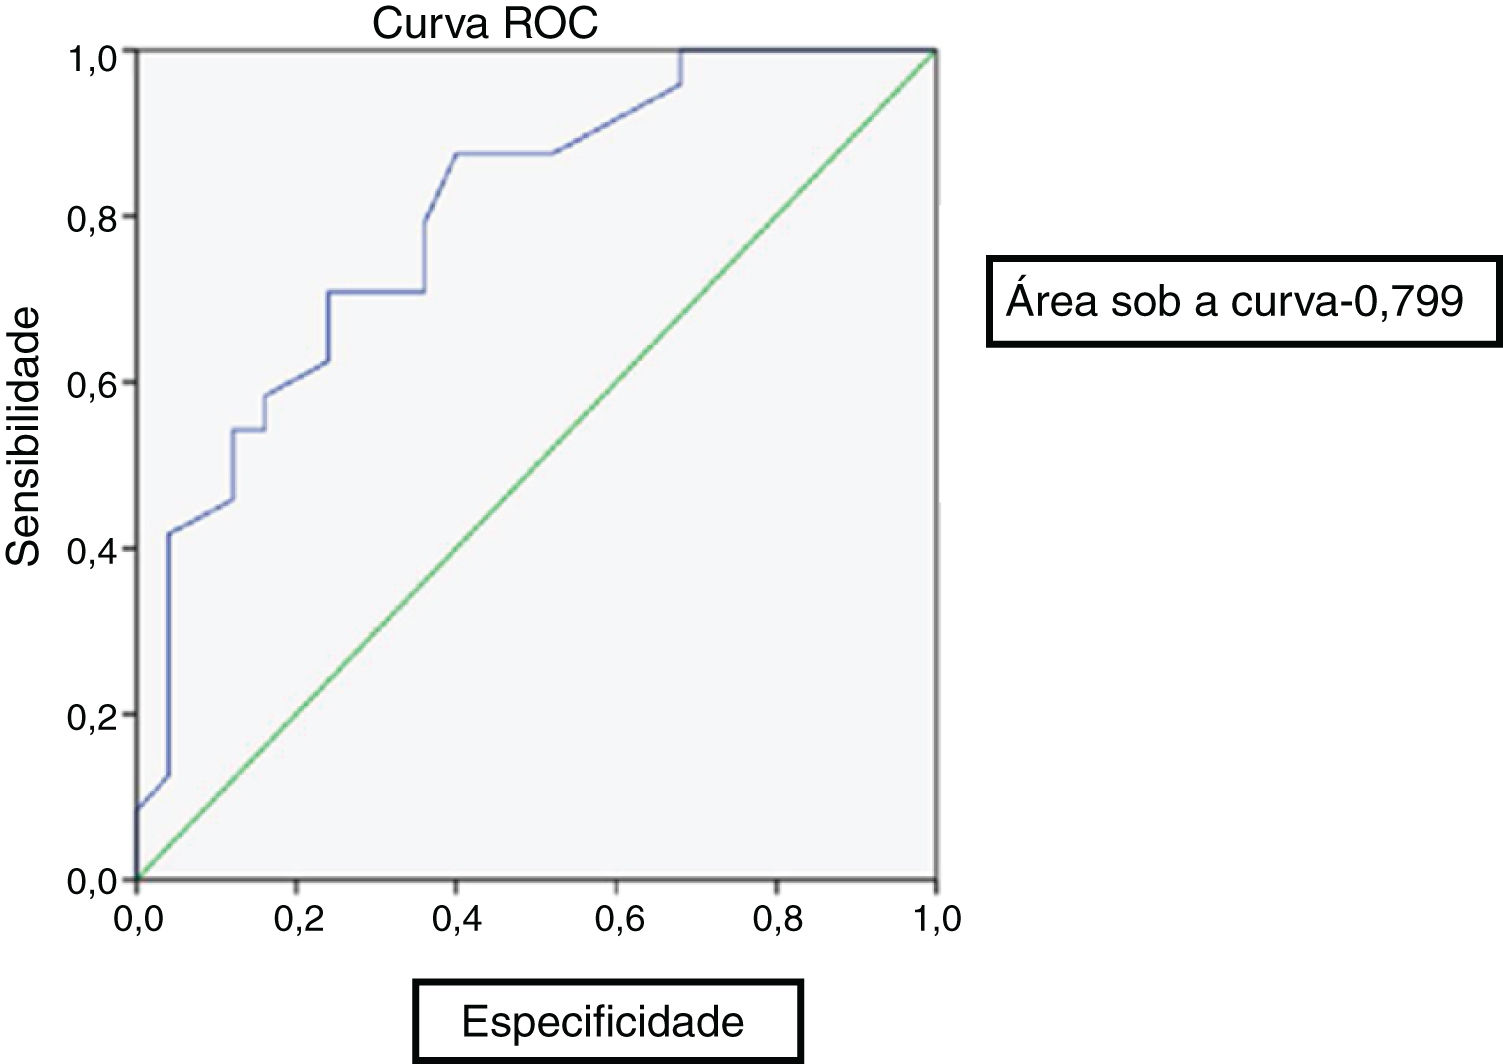
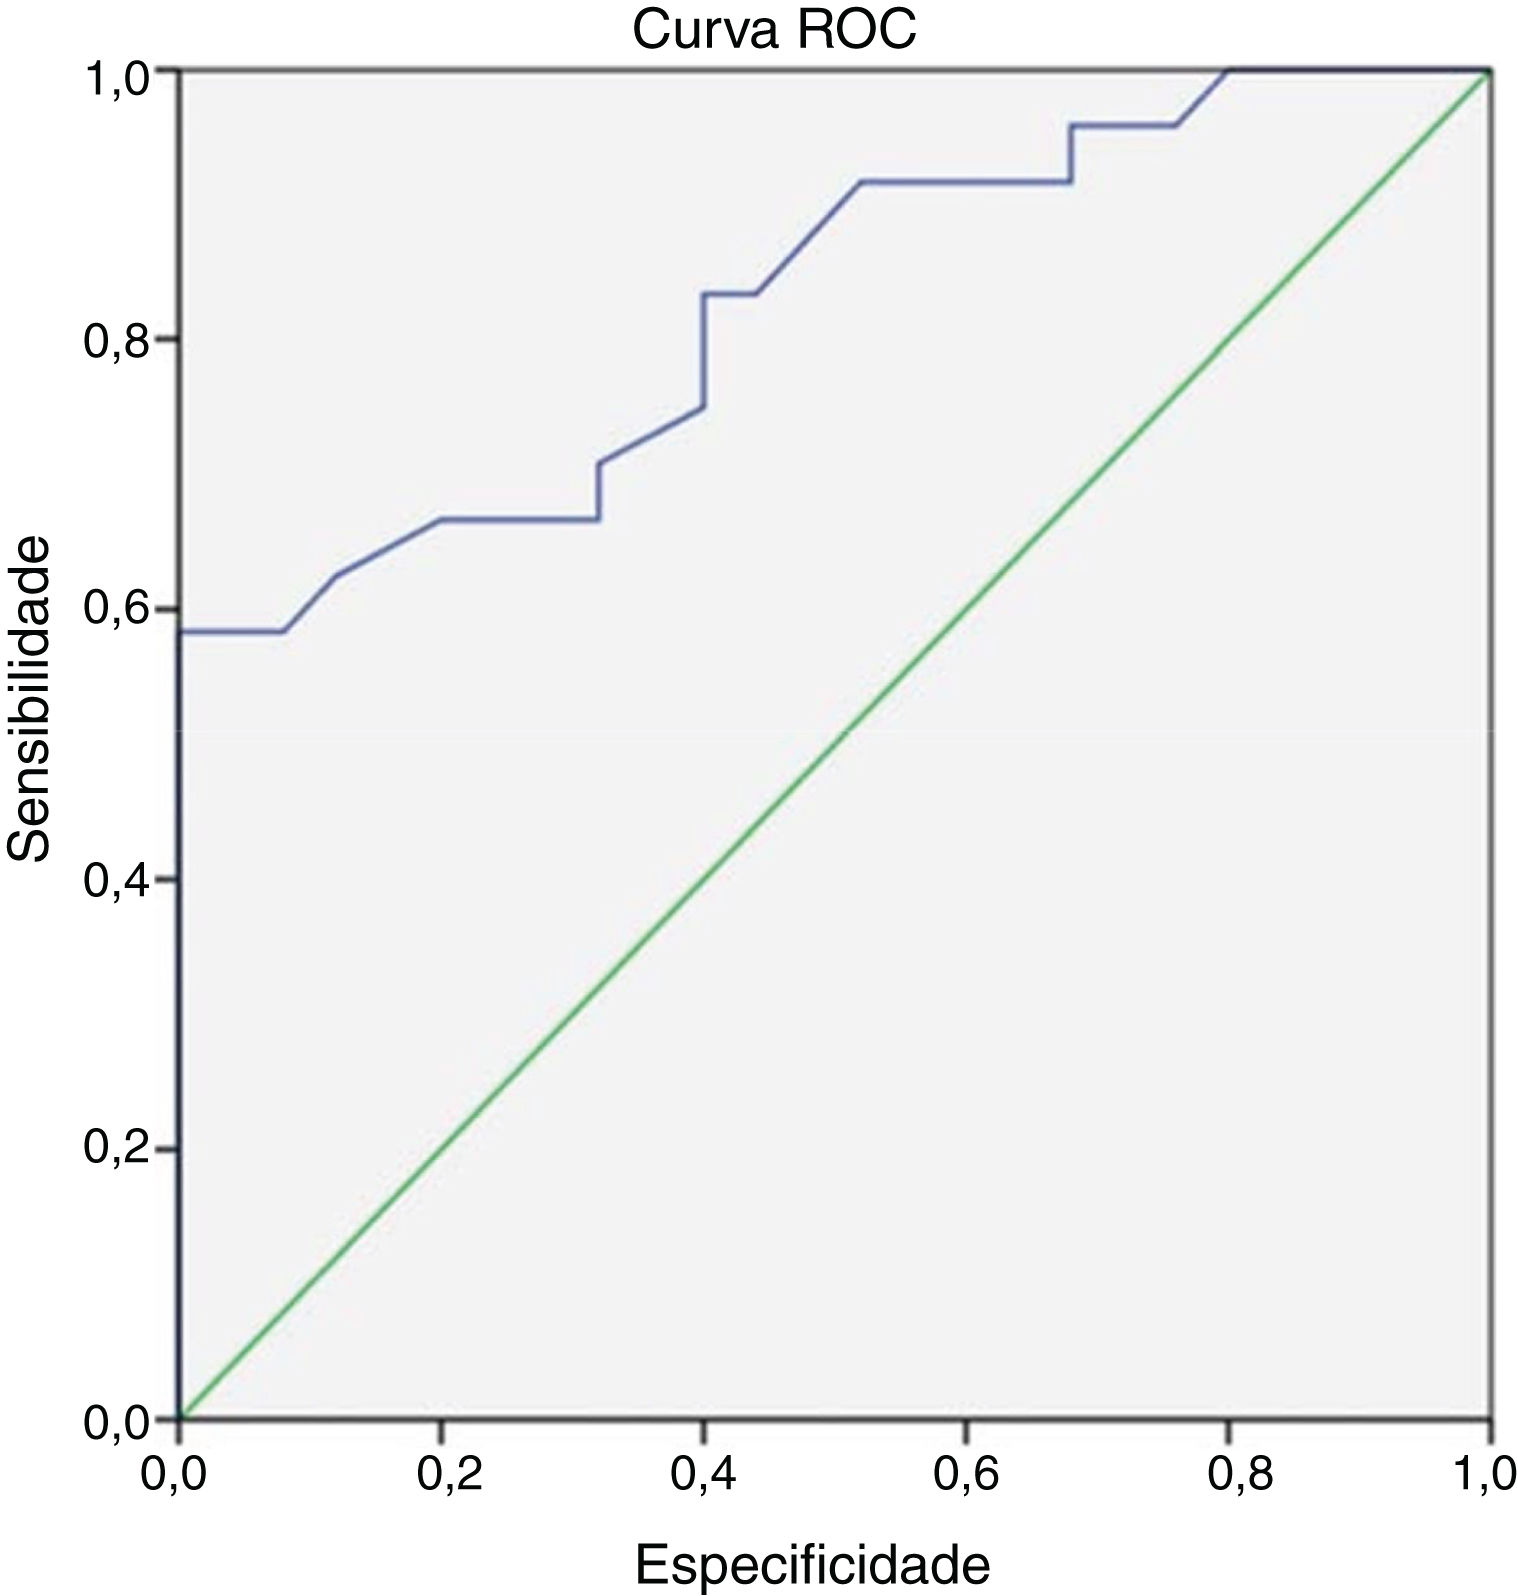
At the end of 8 weeks of treatment, 30 patients were asymptomatic (Table 2). Of these, 28 had no metabolic activity on PET. Taking this as cure, the corresponding CRP and ESR were evaluated. Only 3 patients had reached institutional normal values of CRP and ESR. So, a cut-off value for normalcy was calculated for the markers using ROC curve (Fig. 1). The cut-off value for CRP was 3.6mg/L with a sensitivity of 87% and a specificity of 60%, which was statistically significant with p = 0.002. Similarly, the cut-off value for ESR was 35mm/hour which had a sensitivity of 83% and a specificity of 60% which was statistically significant with a p-value of 0.013 (Fig. 2). Of the 28 asymptomatic patients with negative PET, 17 reached the cut- off value of CRP and 16 for ESR. CRP had a specificity of 82.6% and a sensitivity of 60.7% and ESR had a specificity of 73.9% and a sensitivity of 57.1% when compared with PET as a prognostic marker, with an agreement of 70.6 and 64.7 respectively with statistical significance (Table 3). At the end of analysis of response of patients within 8 weeks of treatment, 30 patients were asymptomatic with no pain and discharge and stopped treatment. This included the two patients with positive activity on PET but with normalized markers. All these patients continued to be asymptomatic till the end of the study.
The titres of ESR, CRP, metabolic activity of PET CT and patient response with treatment. Showing the weekly titres of the markers and their relation to the metabolic activity of PET CT at the beginning of treatment and at the end of 6 weeks. The patient’s symptom status at the end of study period (6 weeks to 15 months) is shown. Culture specific antibiotics given during the course of treatment is included.
| S nº | Age (yrs) | Sex | Diagnosis | CRP | ESR | Initial PET activity | PET CT final | Culture | Medical management | Debridement/ Blopsy | Asymptomatic status/ Treatment status | ||||||||||
|---|---|---|---|---|---|---|---|---|---|---|---|---|---|---|---|---|---|---|---|---|---|
| Week1 | Week2 | Week3 | Week4 | Week5 | Week6 | Week1 | Week2 | Week3 | Week4 | Week5 | Week6 | ||||||||||
| 1 | 67 | M | MOE | 3.5 | 18 | 6.4 | 29 | 27 | 28 | 29 | 28 | 51 | 59 | 99 | 102 | Not done | No | No growth | Itraconazole/ piptaz/ciplox | Yes | 3 months |
| 2 | 76 | M | Central SBO | 0.5 | 32 | 71 | 26 | 7 | 2 | 7 | 25 | 81 | 74 | 72 | 44 | Yes | No | Aspergillus flavus | Inj fortum/ voricoazole/ ciplox | Yes | 4 months |
| 3 | 53 | M | Central SBO | 11 | 20 | 13 | 9 | 4 | 4 | 55 | 55 | 56 | 40 | 36 | 10 | Yes | Yes | Klebsiella | Linezolid and vancomycin, magnex voriconazole, meropenem, minocycline | Yes | 3 months |
| 4 | 62 | F | Central SBO | 23 | 30 | 38 | 20 | 15 | 9 | 91 | 101 | 83 | 56 | 34 | 30 | Yes | No | No culture | Ceftazidime, amikacin and metrogyl, IV magnex and oral linezolid and voriconazole, piptax and ciplox | Yes | 6 weeks |
| 5 | 65 | M | Central SBO | 24 | 117 | 68 | 23 | 21 | 14 | 107 | 108 | 113 | 108 | 97 | 50 | Yes | No | No growth | Piperacillin, voriconazole | Yes | Lost for follow up |
| 6 | 61 | M | Central SBO | 91 | 74 | 54 | 63 | 47 | 34 | 56 | 74 | 61 | 34 | 67 | 54 | Yes | No | Aspergillus flavus | Voriconazole | Yes | 5 months |
| 7 | 64 | F | Central SBO | 13 | 10 | 9 | 4 | 3 | 2 | 19 | 52 | 54 | 43 | 40 | 38 | Yes | Yes | Chryosporim, Pseudomonas acruginosa | Ceftazidime, voriconazole, ciprofloxacin, fluconazole | Yes | 2 months |
| 8 | 55 | M | Central SBO | 24 | 110 | 68 | 23 | 21 | 14 | 98 | 108 | 103 | 108 | 97 | 50 | Yes | No | No culture | Ceftazidime | No | 2 months |
| 9 | 70 | M | Central SBO | 11 | 20 | 13 | 9 | 4 | 4 | 55 | 55 | 56 | 40 | 36 | 30 | Yes | Yes | No culture | Piperacillin | No | Passed away |
| 10 | 73 | M | Central SBO | 25 | 21 | 16 | 10 | 5 | 2 | 95 | 104 | 87 | 60 | 54 | 43 | Yes | No | Candida para psilosis | Voriconazole, piperacillin, meropenem | Yes | 6 weeks |
| 11 | 45 | M | Central SBO | 24 | 21 | 15 | 8 | 3 | 1 | 67 | 80 | 57 | 65 | 45 | 14 | Yes | No | Staph aureus | Voriconazole, piperacillin, clindamycin, cloxacillin, linezolid, ciprofloxacin | Yes | On antibiotics for 1yr and a month, patient had symptomatic relief after 2 months |
| 12 | 78 | M | MOE | 40 | 32 | 25 | 20 | 15 | 5 | 90 | 74 | 70 | 35 | 44 | 52 | Yes | No | Pseudomonas, Candida Albinas | Ciprofloxacin and cefaperazone | No | 2 months |
| 13 | 60 | M | Central SBO | 0.7 | 3.6 | 4 | 4.2 | 3 | 3.3 | 70 | 96 | 103 | 97 | 88 | 58 | Yes | No | Enterococcus fecalis | Ceftazidime, ciprofloxacin, piperacillin, linezolid, fluconazole | Yes | Lost for follow up |
| 14 | 66 | F | MOE | 40 | 43 | 38 | 21 | 22 | 4 | 70 | 34 | 42 | 68 | 52 | 34 | Yes | No | No growth | Ceftazidime, ciprofloxacin, voriconazole | No | Lost for follow up after 6 months IV and voriconazole |
| 15 | 66 | M | MOE | 1.5 | 5.1 | 4 | 2.3 | 1.9 | 0,7 | 40 | 73 | 57 | 52 | 40 | 46 | Yes | No | Gram negative bacteria | Piperacillin voriconazole, itraconazole | No | 2 months |
| 16 | 78 | M | MOE | 20 | 17 | 10 | 9 | 9.2 | 1 | 60 | 61 | 58 | 44 | 30 | 29 | Yes | No | No growth | Ceftazidime | Yes | 2 months |
| 17 | 63 | M | Central SBO | 30 | 120 | 210 | 344 | 400 | 412 | 70 | 77 | 92 | 100 | 90 | 102 | Yes | Yes | No growth | Piperacillin voriconazole, clindamycin | Yes | Antibiotics for 1 month, expired due to septic shock |
| 18 | 77 | M | MOE | 6.5 | 16 | 22 | 30 | 32 | 23 | 54 | 44 | 40 | 36 | 28 | 18 | Yes | Yes | Citrobacter kooseri, Klebsiella pneumoniae, enterococcus faecalis | Ceftazidime, ciprofloxacin | Yes | 2 months |
| 19 | 65 | M | MOE | 36 | 106 | 88 | 42 | 56 | 2 | 86 | 74 | 66 | 42 | 30 | 36 | Yes | Yes | Pseudomonas aeruginosa | Ciprofloxacin, piperacillin | Yes | 2 months |
| 20 | 68 | M | Central SBO | 10 | 22 | 8.04 | 4 | 1.3 | 11 | 96 | 42 | 36 | 53 | 50 | 52 | Yes | Yes | Candida hemulonii | Meropenem, voriconazole | Yes | 6 months |
| 21 | 72 | M | Central SBO | 47 | 79 | 13 | 31 | 26 | 23 | 96 | 107 | 97 | 90 | 88 | 80 | Yes | Yes | Kodamea ohmeri | Cefaperazone, voriconazole, amphotericin | No | 6 months |
| 22 | 73 | M | MOE | 10 | 7.2 | 9.6 | 6 | 8 | 9.8 | 83 | 72 | 94 | 79 | 87 | Yes | Yes | Pseudomonas aeruginosa | Cefaperazone, ciprofloxacin, piperacillin, voriconazole | Yes | 4 weeks of piptaz and 4 months of voriconazole | |
| 23 | 59 | M | MOE | 23 | 20 | 16 | 10 | 4 | 2 | 74 | 55 | 42 | 33 | 20 | 28 | Yes | No | No culture | Piperacillin, ciprofloxacin | No | 6 weeks |
| 25 | 62 | M | MOE | 11 | 6.1 | 5.5 | 10 | 17 | 19 | 49 | 45 | 36 | 51 | 59 | 64 | Yes | Yes | Pseudomonas, Klebsiella, Streptococcus | Piperacillin, voriconazole | Yes | 8 months of voriconazole and 3 months of piptaz |
| 26 | 74 | F | Central SBO | 16 | 10 | 8 | 2 | 1.4 | 0.8 | 46 | 43 | 36 | 29 | 20 | 16 | Yes | No | Aspergillus flavus | Voriconazole, cefaperazone, ciprofloxacin | No | 2 months |
| 27 | 72 | M | Central SBO | 20 | 16 | 12 | 8 | 4 | 2 | 51 | 50 | 40 | 44 | 35 | 38 | Yes | No | No growth | Ceftazidime, ciprofloxacin, piperacillin, linezolid, fluconazole | No | 2 months |
| 28 | 64 | F | MOE | 31 | 15 | 34 | 98 | 108 | 9 | 81 | 46 | 42 | 44 | 34 | 20 | Yes | No | Pseudomonas aeruginosa | Ceftazidime | No | 6 weeks |
| 29 | 61 | M | MOE | 7 | 16 | 18 | 15 | 93 | 1.3 | 50 | 61 | 76 | 85 | 53 | 25 | Yes | No | Pseudomonas aeruginosa | Piperacillin, cefoperazone, voriconazole | Yes | 3 months |
| 30 | 71 | M | Central SBO | 43 | 13 | 6.5 | 6.07 | 5 | 3.2 | 69 | 81 | 68 | 40 | 42 | 38 | Yes | No | No growth | Cefaperazone, ciprofloxacin | Yes | 2 months |
| 31 | 68 | M | Central SBO | 1.4 | 17 | 16 | 13 | 14.5 | 14 | 50 | 54 | 90 | 92 | 66 | 60 | Yes | Yes | No culture | Voriconazole, linezolid | No | 7 weeks of voriconazole |
| 32 | 60 | M | MOE | 71 | 57 | 12.57 | 6.5 | 5.19 | 1.62 | 97 | 94 | 83 | 47 | 25 | 14 | Yes | No | No growth | Piperacillin, meropenem | Yes | 3 months |
| 33 | 70 | M | MOE | 11.58 | 11.94 | 27 | 24 | 10 | 2.28 | 61 | 56 | 81 | 32 | 35 | 30 | Yes | No | Candida non albicans (SG), Pseudomonas aeruginosa (SG) | Voriconazole, amphotericin B, doxycycline | Yes | 2 months |
| 34 | 80 | F | MOE | 9.3 | 19 | 5.79 | 10.85 | 9.9 | 8 | 90 | 69 | 88 | 17 | 62 | 60 | Yes | Yes | No growth | Vancomycin, meropenem, voriconazole | No | 10 weeks |
| 35 | 63 | F | Central SBO | 8.59 | 11.19 | 10 | 9 | 6 | 5.6 | 97 | 30 | 32 | 40 | 20 | 18 | Yes | No | No growth | Ceftazidime | No | 6 weeks |
| 36 | 70 | F | Central SBO | 17.68 | 24.46 | 67.31 | 50 | 46 | 30 | 37 | 57 | 60 | 48 | 32 | 50 | Yes | Yes | Staphaureus (MG), Candida albicans | Ceftazidime, ciprofloxacin | No | Lost for follow up after 4 weeks |
| 37 | 56 | F | Central SBO | 10 | 18.92 | 16 | 14 | 8.4 | 563 | 60 | 63 | 71 | 74 | 65 | 60 | Yes | Yes | No culture | Voriconazole | No | 4 months |
| 38 | 54 | M | MOE | 4.76 | 4.7 | 11.5 | 11 | 16.8 | 4,3 | 37 | 47 | 57 | 47 | 30 | 36 | Yes | Yes | Candida no albicans (MG) | Meropenem, voriconazole | Yes | 6 months |
| 39 | 62 | M | Central SBO | 10 | 7 | 5 | 3 | 11 | 9 | 46 | 47 | 44 | 38 | 42 | 40 | Yes | Yes | Pseudomonas aeruginosa (MG) | Ceftazidime | No | 2 months |
| 40 | 75 | M | MOE | 3 | 2 | 54 | 15 | 2 | 0.93 | 23 | 23 | 30 | 27 | 10 | 5 | Yes | No | Candida albicans | Ceftazidime | No | 6 weeks |
| 41 | 75 | M | MOE | 20 | 22 | 35 | 40 | 30 | 20 | 44 | 50 | 38 | 30 | 67 | 100 | Yes | Yes | Aspergillus flavus, enterobacter sp. | Ciprofloxacin, cefaperazone | Yes | 6 months |
| 42 | 73 | M | MOE | 11 | 31 | 20 | 14 | 9.14 | 1.66 | 103 | 100 | 100 | 115 | 80 | 70 | Yes | Yes | Invase aspergillosis | Ciprofloxacin, cefaperazone | Yes | 2 months |
| 43 | 71 | M | MOE | 8.38 | 17.26 | 22.4 | 20 | 15 | 13.2 | 30 | 80 | 54 | 40 | 60 | 76 | Yes | Yes | No growth | Ciprofloxacin, ceftazidime | Yes | < 8 months |
| 44 | 75 | M | Central SBO | 66 | 54 | 6.8 | 2.1 | 4 | 5 | 12 | 15 | 8 | 14 | 7 | 6 | Yes | No | Pseudomonas aeruginosa (moderate growth), Staphylococcus aureus | Ciprofloxacin, cefaperazone | No | 3 months |
| 45 | 65 | F | MOE | 152 | 112 | 95 | 88 | 70 | 73 | 74 | 74 | 80 | 64 | 123 | 80 | Yes | Yes | Aspergillus fumigatus | Cefaperazone, ciprofloxacin, voriconazole | No | Lost for follow up after 6 weeks |
| 46 | 71 | M | MOE | 47 | 70 | 13 | 31 | 26 | 2 | 90 | 100 | 97 | 90 | 80 | 19 | Yes | Yes | Staph aureus, ryosporium sp. | Voriconazole, terbinafine | Yes | 6 months |
| 47 | 70 | F | MOE | 4.76 | 4.7 | 11.5 | 12 | 16.8 | 4.3 | 60 | 50 | 52 | 38 | 32 | 24 | Yes | No | Pseudomonas aeruginosa (scanty growth) | Ciprofloxacin, ceftazidime, | No | 3 months |
| 48 | 57 | M | MOE | 24.9 | 1,3 | 22.4 | 80.9 | 52 | 34 | 38 | 30 | 24 | 18 | 20 | 67 | Yes | Yes | Pseudomonas aeruginosa (heavy growth) | Ceftazidime, piperacillin | Yes | Lost for follow up after 4 months |
| 48 | 62 | F | Central SBO | 12 | 6.1 | 5.5 | 10 | 2.32 | 1.38 | 30 | 44 | 50 | 19 | 52 | 27 | Yes | No | Pseudomonas aeruginosa, cryosporium | Ceftazidime, ciprofloxacin | Yes | 2 months |
| 50 | 69 | M | Central SBO | 31 | 13 | 34 | 98 | 108 | 10 | 81 | 42 | 42 | 44 | 34 | 20 | Yes | No | Aspergillus flavus | Ciprofloxacin, cefaperazone, itraconazole | No | 3 months |
| 51 | 88 | M | Central SBO | 22.56 | 8.4 | 70 | 60 | No | Pseudomonas aeruginosa | Ceftazidime, ciprofloxacine | No | 3 months | |||||||||


At the end of 8 weeks, the remaining 21 patients had positive activity (Table 2). They were further monitored though it was beyond the planned study period. Of these, 4 patients had normalized CRP and 4 had normalized ESR. Of these 21 patients, 9 stopped treatment within 6 months. Another four patients completed treatment within 15 months. Of the total 51 patients, 43 successfully completed treatment. Of the remaining 8 patients, while two patients relapsed, another two succumbed to the long illness. Six patients were lost to followup at the end of 6 months of which half were asymptomatic with ongoing antibiotics waiting for the markers to stabilize. Readmissions were noted in four patients on Voriconazole with transaminitis and another two with relapse.
DiscussionSeveral studies including ours noted a sex distribution favoring male predominance. Because of the rarity of the disease, our sample size was small though comparable to others. We did not encounter pediatric osteomyelitis unlike Truck and Thompson et al. who described 2 cases affecting the clivus.16 We had 48 diabetic patients. Shaun and Shyang et al. reported that 94.7% of their 18 patients were diabetics.17
In a study of 22 patients by Shaun et al., organisms were identified only in 63.2%. Nicholas et al. reported on 31 cases of SBO in which 61% grew Pseudomonas (49% were ciprofloxacin sensitive and 16% resistant) followed by Aspergillus species (10%). Ciprofloxacin monotherapy was the treatment of choice initially in SOB.17 We had an almost equal number of pseudomonas and fungal growth (Table 1). Our patients received antifungals for 6 months to 1year similar to Volsky study.18 In view of high incidence of fungal organisms it is a point to ponder whether administration of long-term antibiotics led to secondary fungal infection. However, there is no available literature regarding this possibility.
Of the 51 patients, 23 were managed medically alone and 28 underwent some mode of surgical debridement (Table 2). Complete or near- complete disease clearance was possible only in twelve patients. Site and morbidity were key factors in limiting debridement in the remaining 16 patients. All the 12 patients with good clearance showed immediate improvement after the procedure. Some of them had a change of antibiotic post- procedure. Hence it is difficult to say whether the improvement was due to surgery alone. But clinically we felt that a complete surgical debridement cut short the treatment duration apart from yielding positive culture. However, in a study by Nicholas et al., only 3 patients out of the 18 underwent surgery with no improvement.19 In Sang et al. study, 9 among 28 patients underwent surgery. He reported that intraoperative cultures did not yield additional information over ear swabs and disease persisted.16 Our contrary experience included the two patients with intracranial debridement who recovered rapidly afterwards. It may be recommended to opt for complete debridement if feasible to shorten treatment duration. Khan et al. opined the need of surgical debridement when the treatment gets prolonged.20 Shaun et al. described varying duration of antibiotics from 1 month to 6 months.8 The Bone Infection Unit in Oxford, United Kingdom, recommended treatment of 6 weeks of intravenous treatment followed by 6–12 months of oral medication, guided by clinical response. Our patients received 6 weeks to 15 months of antimicrobials.
At the time of diagnosis both CRP and ESR were elevated in all cases. Those who responded showed relief of pain and discharge with trending down of CRP followed by ESR. The decrease in levels correlated with reduction of metabolic activity in PET scan. There was no literature available on SBO regarding this for comparison. There was no correlation with the extent of disease though clinically we felt clival lesions extending to both sides of the skull base were poor responders. Michail et al.’s study on diabetic foot osteomyelitis studied the usefulness of CRP, ESR, total count and procalcitonin as markers for activity.21 They opined that these values could not be relied upon alone to predict outcome. All markers trended down with treatment but the continued elevated ESR was a pointer to ongoing osteomyelitis. Shaun’s study reported total count as a better marker which was unlike our observation where total count was normal for majority of patients.16 Patients with disease that resolved after 6–8 weeks of intravenous therapy showed a 21.71% reduction in mean ESR values compared with the group with persistent disease, in which ESR values remained unchanged. A similar downward trend was also seen in CRP levels. None of our patients reached the institutional normal value of CRP and ESR when they became symptom- free or disease- free. But these patients reached the cut-off value for CRP (≤3.6mg/L) and for ESR (≤35mm/hour). Both were found to be statistically significant. ESR took longer to normalize. Since a similar study had not been conducted before no previous literature was available for comparison. These values could be taken as indicators to stop treatment. In our series, one asymptomatic patient had a rise in CRP and ESR after an unrelated surgical procedure. In our study, CRP had a specificity of 82.6% and a sensitivity of 60.7% and ESR had a specificity of 73.9% and a sensitivity of 57.1% when compared with PET. Though values were less it was statistically significant, and we found that it was significant clinically as well. It was particularly helpful to time the PET scan once the patient became asymptomatic.
At the end of 8 weeks, 17 of the total 30 asymptomatic patients reached the cut- off value of CRP and 16 reached the cut- off value of ESR. There was excellent correlation between inflammatory markers and PET CT. We found that CT and MRI were not reliable tools to assess response to treatment except to find new areas of involvement in case of development of fresh symptoms. Kroonenburgh et al. mentioned the disadvantages of CT and MRI over PET CT.12 CT scan under- appreciates the soft tissue and intracranial structures besides its inability to distinguish infection from malignancy. Because normalization of bony changes may never occur despite resolution of the infection, CT is limited in tracking treatment response. MRI is usually not useful in monitoring the response to therapy in patients with osteomyelitis, because marrow changes caused by inflammation take 2–6 months to return to normal. As per Gherini et al. single photon emission CT improves the monitoring of therapy.22 We did a PET CT at the end of 6–8 weeks for all patients and subsequently to monitor the progression of disease if required. There were 10 asymptomatic patients on intravenous antibiotics with PET CT showing persistent metabolic activity. CRP and ESR in these patients showed consistently stable values in the cut-off range showing that inflammatory markers can predict resolution of disease earlier than FDG−PET CT. A medical board from the departments of Otorhinolaryngology, Infectious disease control, Nuclear medicine, Neurosurgery and Microbiology discussed further action plan on these 10 patients and decided to withhold antimicrobials in those with normalized markers for more than 3 months with monthly monitoring of CRP and ESR and 3rdmonthly FDG−PET CT. Among these 10 asymptomatic patients in whom treatment was stopped based on a medical board decision, two had exacerbations. Another two showed no metabolic activity after almost a year. So, a consistent stable normalized value of CRP and ESR may indicate disease control though not cure. All patients with no metabolic activity on PET have remained symptom free to date, indicating cure. The observations pointed to a fact that SBO patients while on antibiotics showed a predictable pattern of becoming asymptomatic first followed by normalized CRP and then normalized ESR followed by hybrid scan. The treatment has to continue in an asymptomatic patient till the PET scan becomes normal or till the inflammatory markers show stable normalized values.
During the course of the study a treatment pattern evolved which we followed. Culture specific antibiotics (if available) were given preferably as combination therapy for a minimum of 6–8 weeks in a patient with a positive response. With poor response the earliest attempt would be made for deep tissue sampling. Antifungals were initiated in symptomatic patients with no culture and not responding to the empirical treatment. We did observe that generally non-responders were fungal SBO. Antifungals required a longer duration from 6 months to one year or more compared to antibiotics. We now terminate antibiotics in a patient who is clinically asymptomatic with a negative PET scan at the end of 6–8 weeks. If the scan continued to show activity after prolonged treatment, antibiotics were stopped when the inflammatory markers reached and stabilized at the cut -off value of ≤ 3.6mg/L for CRP and ≤ 35mm/hour for ESR for at least 8–12 weeks. This was based on our observation of 10 asymptomatic patients with stable markers but active PET scan. Such patients were monitored monthly to watch for rising titers and PET every 3 months.
Our observations may be used with some caution in low resource setting where there is no access to hybrid imaging. In a tertiary care facility, this helps to time the imaging to decide upon termination of antibiotics. Repeat imaging may be done if the inflammatory markers have stabilized for 8–12 weeks. The sample size was limited due to the rarity of the disease and long duration of follow up required. A similar study utilizing PET MRI with its superior functional assessment, spatial resolution and of course less radiation is required.23 The study population with multiple combination therapies may have acted as confounding variables.
ConclusionCRP and ESR are reliable tools for detection, progression and resolution of disease status as compared to PET CT in SBO. The lesser specificity of the markers may limit their use as the sole indicator of resolution of disease. Nevertheless, they can be used effectively, repeatedly, and economically to time hybrid scans during the course of the disease to decide upon antibiotic termination. This study may be utilised to evolve a treatment guideline in the management of SBO.
Ethical statementThe study protocol was reviewed and approved by the Institutional Ethics Committee of our institute (IRB-AIMS 2018−029). It was in accordance with the ethical standards laid down in the Declaration of Helsinki. All interventions and investigations were done with informed consent of the patient.
Conflicts of interestThe authors declare no conflicts of interest.
Professor Shanmugham Sundaram, Department of Nuclear Medicine, Amrita Institute of Medical Sciences.
Professor Sundaram, Department of Biostatistics, Amrita Institute of Medical Sciences, Kochi, India
Dr Vidya, Dr Merlin, Department of Infectious Diseases, Amrita Institute of Medical Sciences.
Peer Review under the responsibility of Associação Brasileira de Otorrinolaringologia e Cirurgia Cérvico-Facial.


