
Salivary pepsin has emerged as a biomarker for Laryngopharyngeal Reflux (LPR), which, however, has been questioned for its efficacy due to a lack of supporting medical data. Therefore, this study analyzed the diagnostic value of salivary pepsin for LPR and assessed a better cutoff value.
MethodsStudies were searched in PubMed, Embase, and Cochrane Library from their receptions to October 1, 2021. Then, RevMan 5.3 and Stata 14.0 were utilized to summarize the diagnostic indexes for further meta-analysis. Data were separately extracted by two reviewers according to the trial data extraction form of the Cochrane Handbook. The risk of bias in Randomized Control Trials (RCTs) was evaluated with the Cochrane Risk of Bias Tool.
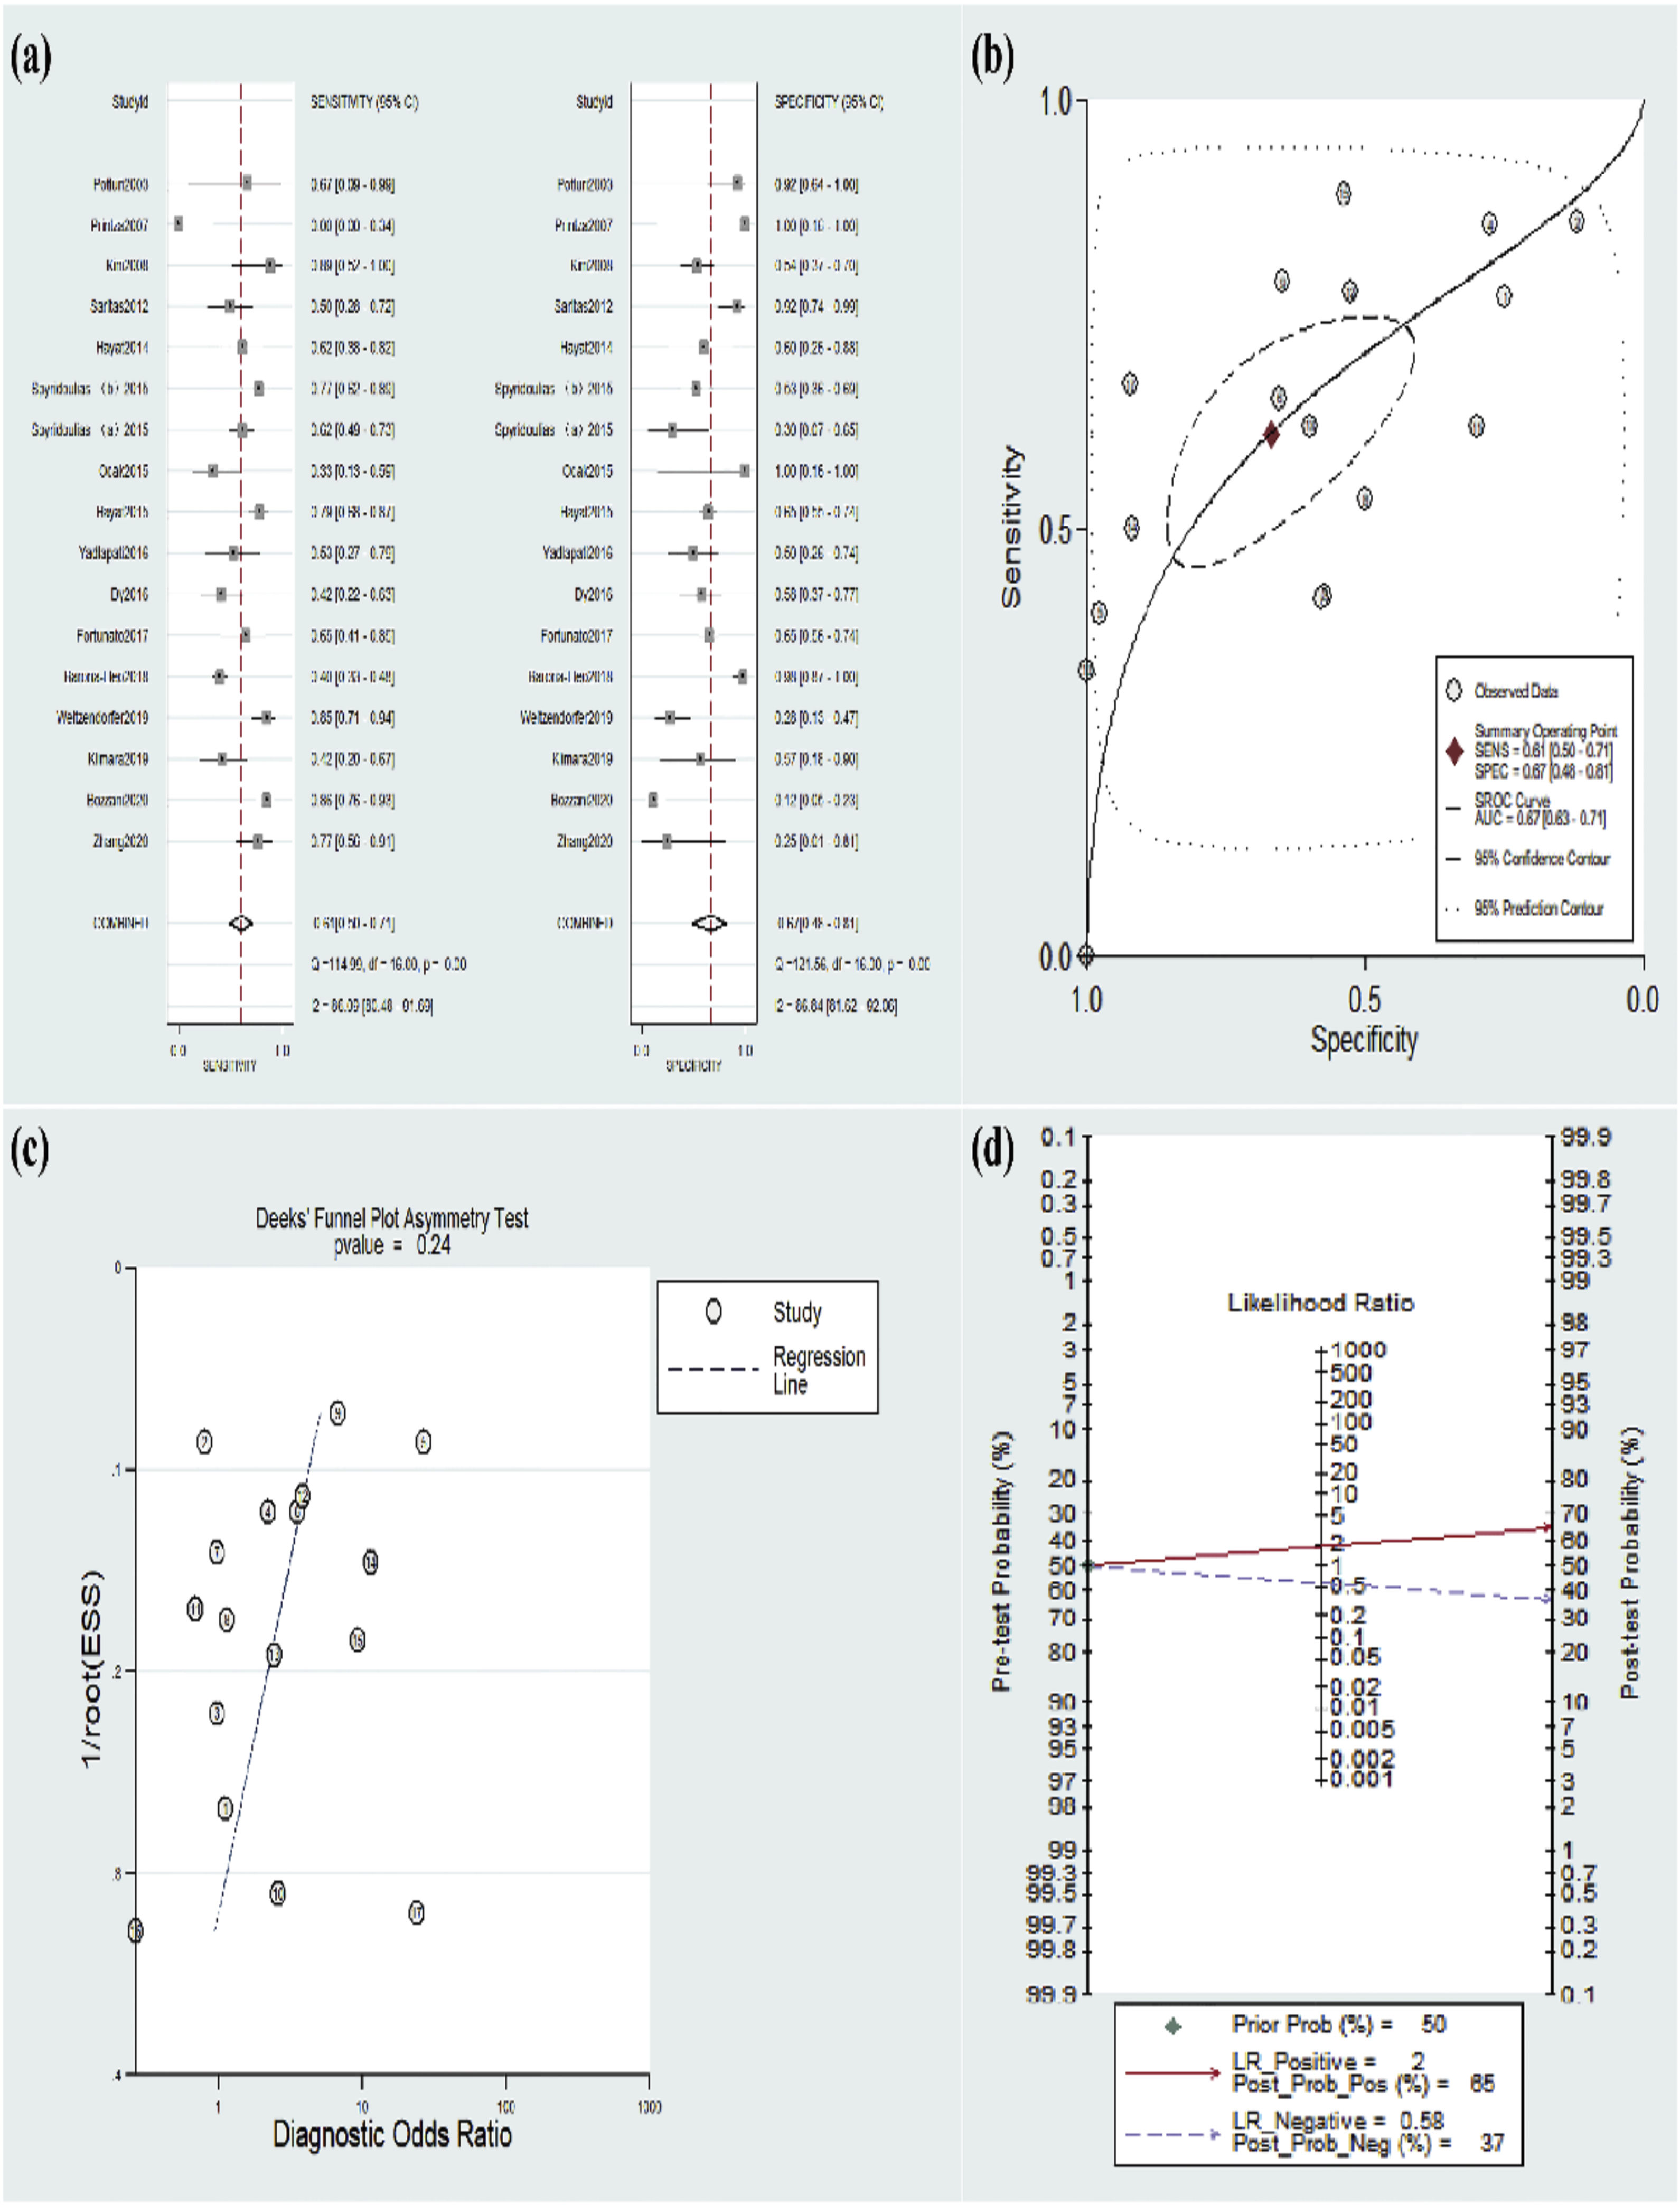
ResultsA total of 16 studies matched the criteria and were subjected to meta-analysis. The results revealed a pooled sensitivity of 61% (95% CI 50%–71%), a pooled specificity of 67% (95% CI 48%–81%), a positive likelihood ratio of 2 (95% CI 1.2–2.8), a negative likelihood ratio of 0.58 (95% CI 0.47‒0.72), and the area under the receiver operating characteristic curve of 0.67 (95% CI 0.63‒0.71). Subgroup analyses indicated that the cutoff value of pepsin at 50 ng/mL had a higher degree of diagnostic accuracy than that of pepsin at 16 ng/mL in cohort studies.
ConclusionThe review demonstrated low diagnostic performance of salivary pepsin for LPR and that the cutoff value of 50 ng/mL pepsin had superior diagnostic accuracy. Nevertheless, the diagnostic value may vary dependent on the utilized diagnostic criteria. Therefore, additional research is needed on the improved way of identifying salivary pepsin in the diagnosis of LPR, and also longer-term and more rigorous RCTs are warranted to further assess the effectiveness of salivary pepsin.
Laryngopharyngeal Reflux (LPR) refers to a disease characterized by symptoms, signs, and tissue changes in the aerodigestive upper tract attributed to the retrograde movement of gastric contents.1 LPR has raised mounting concerns due to the persistence of symptoms and its impact on the quality of life of patients.2,3 Moreover, accumulating studies have demonstrated that LPR contributes to the development of numerous pharyngeal voice diseases and even respiratory diseases. In addition, a plethora of LPR patients may develop noticeable pharyngeal symptoms, such as pharyngeal sensation and dysphagia, and laryngeal symptoms, including hoarseness, sore throat, and chronic cough, without any symptoms of esophageal injury (such as acid reflux and heartburn).4 As a survey reported, 10% of outpatients presenting to the otolaryngology department suffered from LPR5 with diverse non-specific clinical manifestations. Currently, LPR patients are clinically screened through clinical manifestations and laryngoscopic findings as per the Reflux Finding Scores (RFS) or the Reflux Symptom Index (RSI). Moreover, the diagnosis of patients with suspected LPR on the scale may be confirmed or excluded by a Proton Pump Inhibitor (PPI) test or 24 h laryngopharyngeal pH monitoring. However, the RSI and RFS scores are poorly specific, highly subjective, and less reliable.6 Additionally, the PPI test causes various side effects, including chronic kidney disease, acute interstitial nephritis, drug interaction with hepatic drug metabolites, Clostridium difficile infection, collagenous colitis, and osteopenia.7 Meanwhile, 24 h laryngopharyngeal pH monitoring, the gold standard for LPR diagnosis, has not been extensively applied given its low sensitivity, high false-negative rate, invasiveness, and high cost.8 As a result, a necessity has arisen in the last few years to identify a sensitive and noninvasive diagnostic approach for LPR, which is expected to be fulfilled by the salivary pepsin test.
The salivary pepsin test is considered the most promising approach for the diagnosis of LPR because of its extremely sensitive, noninvasive, and pragmatic characteristics.9 Nonetheless, a wide range of procedures (time and number) and methodologies (cutoff value and pepsin testing) have been used for saliva sampling, which results in a wide variation in diagnostic findings. Thus far, a consensus has not been reached regarding normal values for salivary pepsin testing. Therefore, a systematic review was conducted by Wang et al. to analyze the diagnostic efficacy of salivary pepsin for LPR.10 This review, however, only included studies until 2017 and lacked explorations of various diagnostic cutoff values.
In this study, a novel systematic review was developed by updating and performing the meta-analysis to identify different cutoff values of salivary pepsin, thus evaluating the diagnostic accuracy of salivary pepsin.
MethodsSearch strategiesThe present systematic review was conducted in accordance with the Preferred Reporting Items for the Statement of Systematic Reviewing and Meta-analysis (PRISMA). Related studies up to October 1, 2021, were searched in Medline (via PubMed), Embase (via OvidSP), and the Cochrane Library as per the PRISMA guidelines11 with the use of Medical Subject Headings and text words, including (‘pepsin’ or ‘pepsinogen’ or ‘pepsin 1’ ‘pepsin 3’ or ‘pepsin A’) AND (‘saliva’ or ‘spit’ or ‘spittle’) AND (‘Reflux, Supraesophageal Gastric (SEGR)’ or ‘Gastric Reflux, Supraesophageal (SEGR)’ ‘Supraesophageal Gastric Reflux (SEGR)’ or ‘Reflux, Supraesophageal Gastric’ or ‘Gastric Reflux, Supraesophageal’ ‘Supraesophageal Gastric Reflux’ or ‘Gastric Regurgitation’ or ‘Regurgitation, Gastric’ or ‘laryngopharyngeal reflux’). The search strategy was supplemented by manually searching the reference lists of the included studies.
Inclusion and exclusion criteriaThe inclusion criteria were as follows: (1) Original studies recently published in English; (2) Studies evaluating the utility of salivary pepsin for the diagnosis of LPR; (3) Studies enrolling healthy controls or control patients who showed pharyngeal-laryngeal symptoms instead of LPR; (4) Studies presenting sufficient data to construct a 2 × 2 contingency table, that is, presenting false and true positives and negatives to calculate the accuracy of the diagnosis. The exclusion criteria of related studies were as follows: (1) Reviews, case reports, or letters to the editor; (2) Studies lacking a control group; (3) Studies that tested pepsin in biology samples other than saliva, including pharyngo-laryngeal tissues, serum, plasma, and sputum from a biopsy; (4) Studies whose authors failed to provide sufficient data after being contacted.
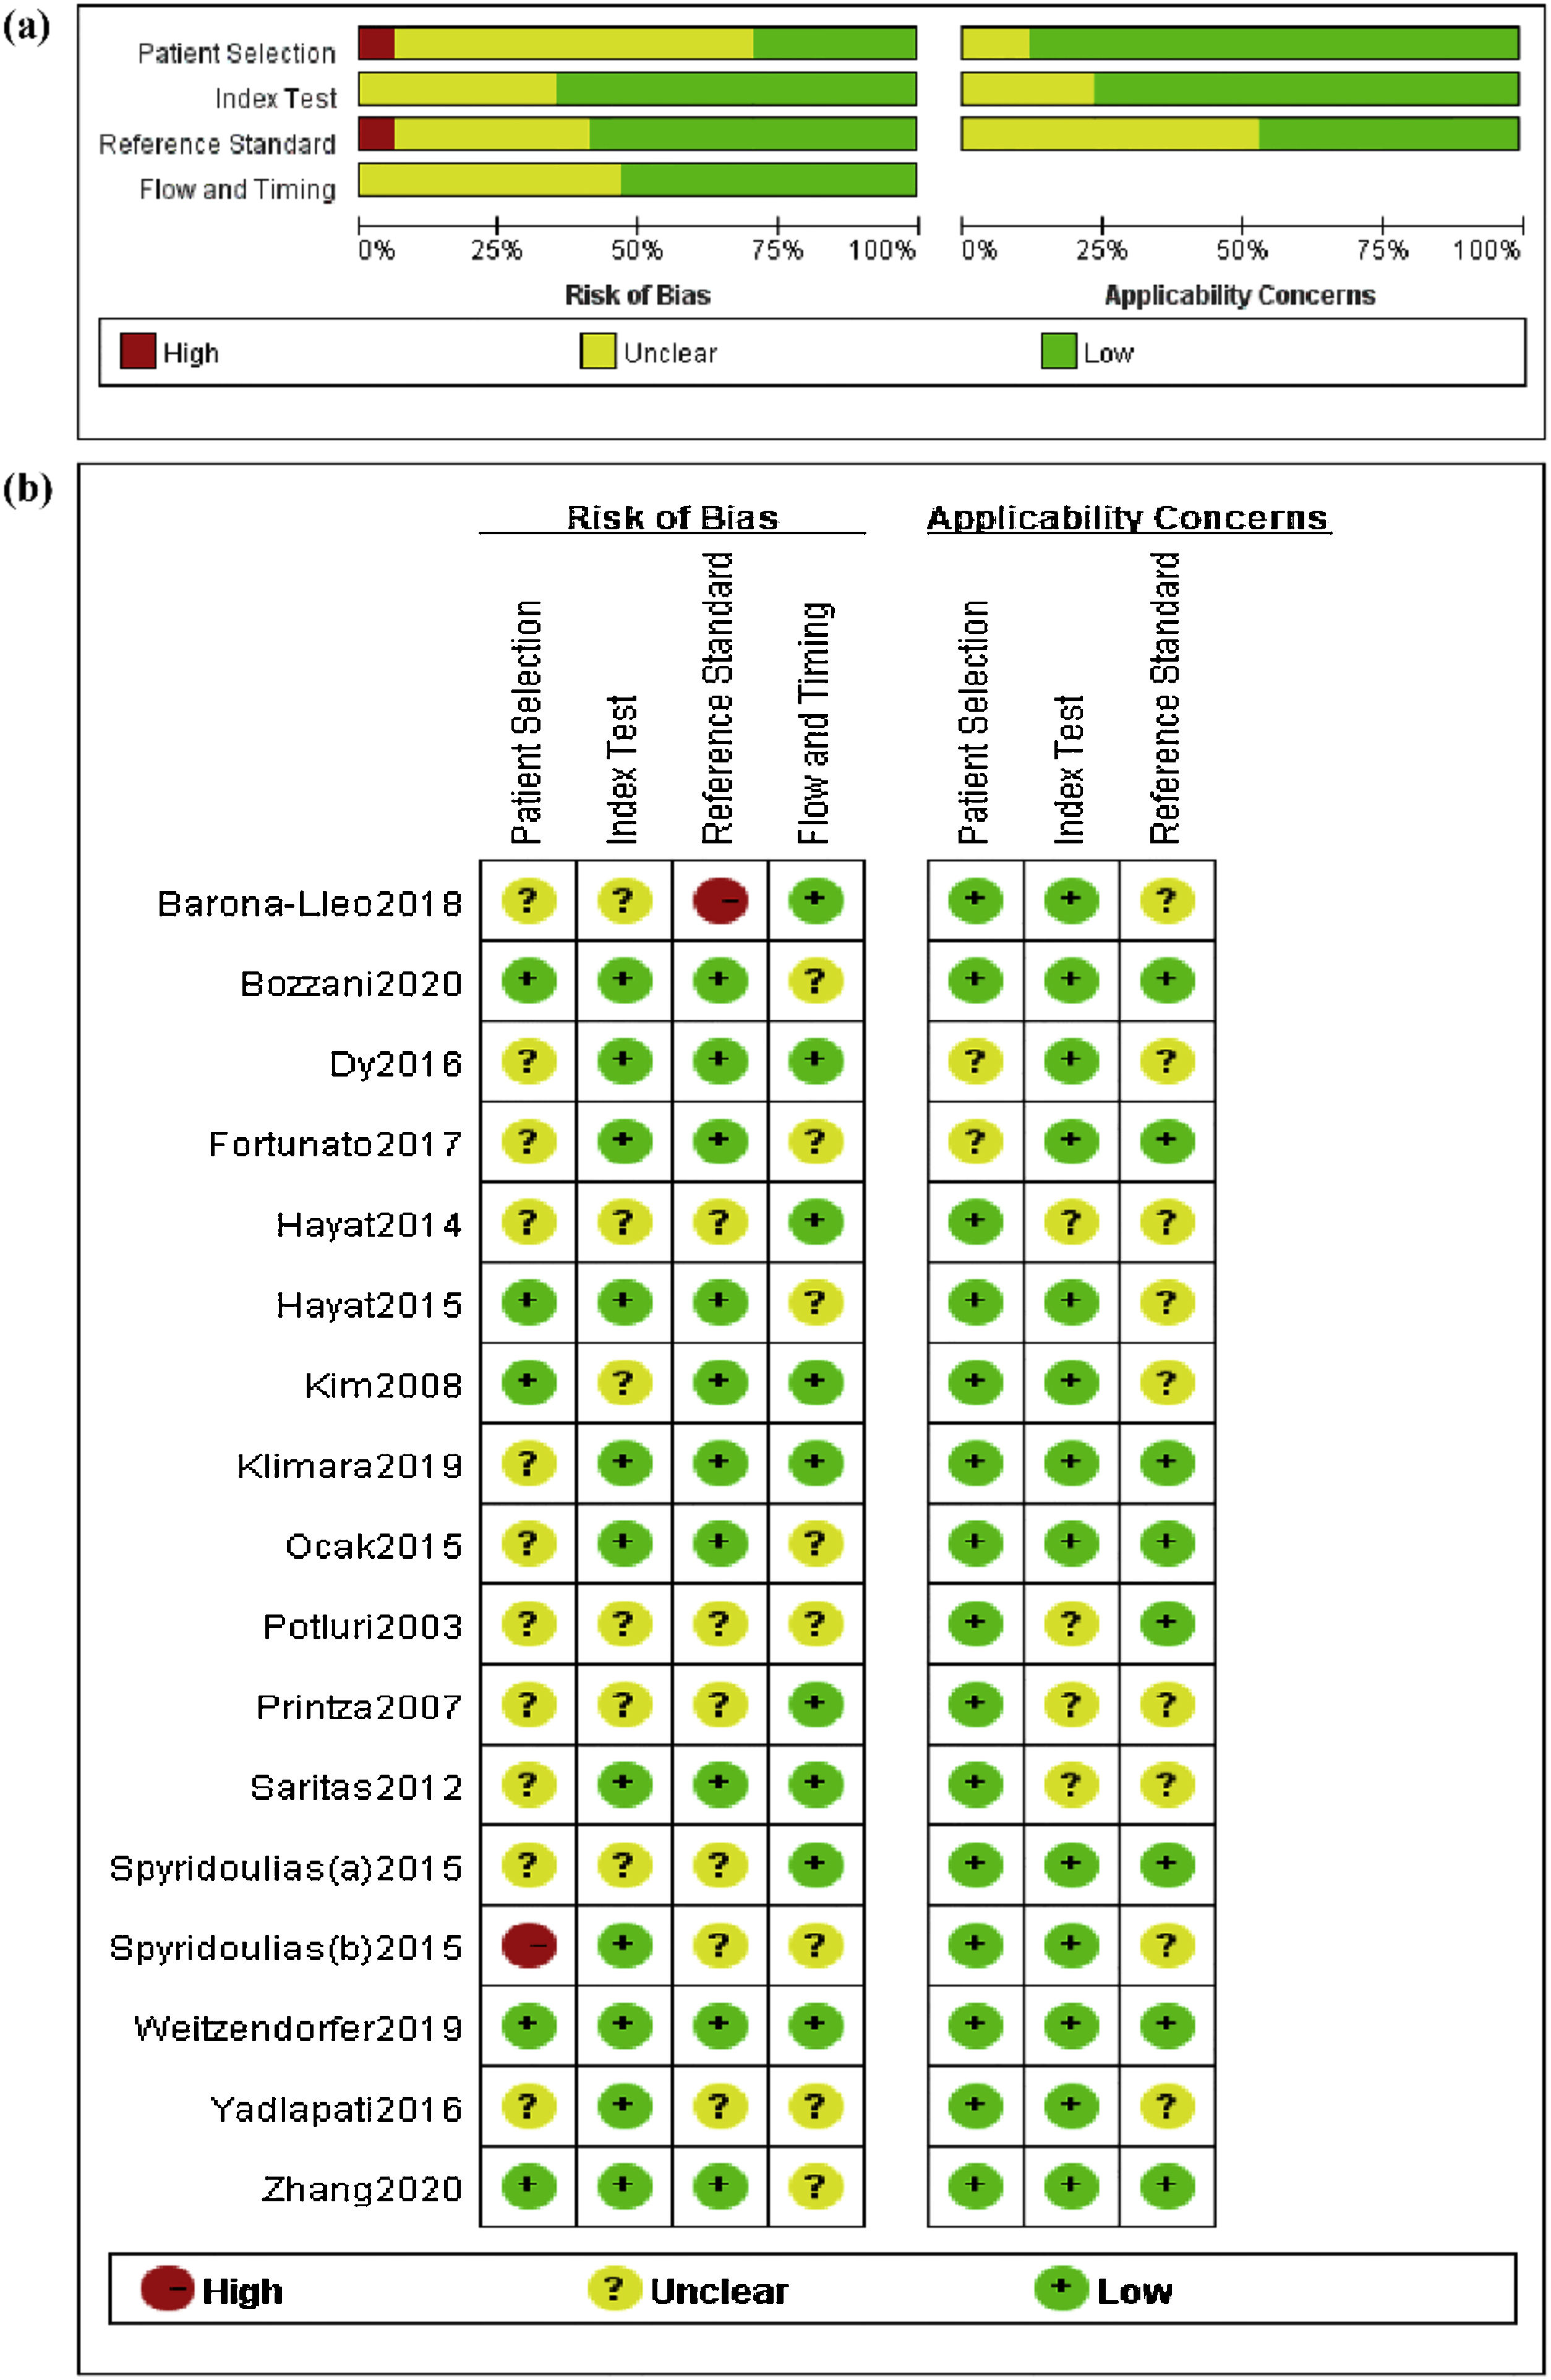
Data extraction and quality evaluationThe literature retrieved from databases were respectively examined by two reviewers (WY Jing and L Luo) on basis of the PRISMA guidelines,11 and the risk of bias and the quality of the included studies were assessed with the Quality Evaluation of Diagnostic Accuracy Literature-2 (QUADAS-2).12 Disagreements were resolved through discussion. The quality was identified with two criteria including applicability issues and bias risk. In addition, a summary chart was created to analyze the risk of bias (Fig. 1).
Data investigation and risk of bias summary (b) of studies included in the meta- analysis.")
Data were analyzed with Stata SE 14.0 (StataCorp; College Station, TX, USA). In this study, a bivariate mixed model was used to analyze the diagnostic Odds Ratio (DOR), Negative Likelihood Ratio (NLR), Positive Likelihood Ratio (PLR), specificity, and sensitivity. The diagnostic accuracy was assessed by plotting the Summary Receiver Operating Characteristic (SROC) curve in which Area Under the SROC Curve (AUC) values of 0.5∼0.7, 0.7∼0.9, and >0.9 respectively suggested a low, moderate, and high degree of diagnostic accuracy. A Fagan plot was created to clarify the correlation among posterior test probability, likelihood ratio, and prior probability. Meanwhile, the sensitivity, specificity, and AUC values with 95% Confidence Intervals (CIs) were calculated for several cutoff values (such as 16 ng/mL and 50 ng/mL). Additionally, the heterogeneity was analyzed based on the Q-test (p < 0.05 represented significant heterogeneity) and the I²statistic (I² >50% marked significant heterogeneity). A Deeks’ funnel plot was utilized to evaluate publication bias.
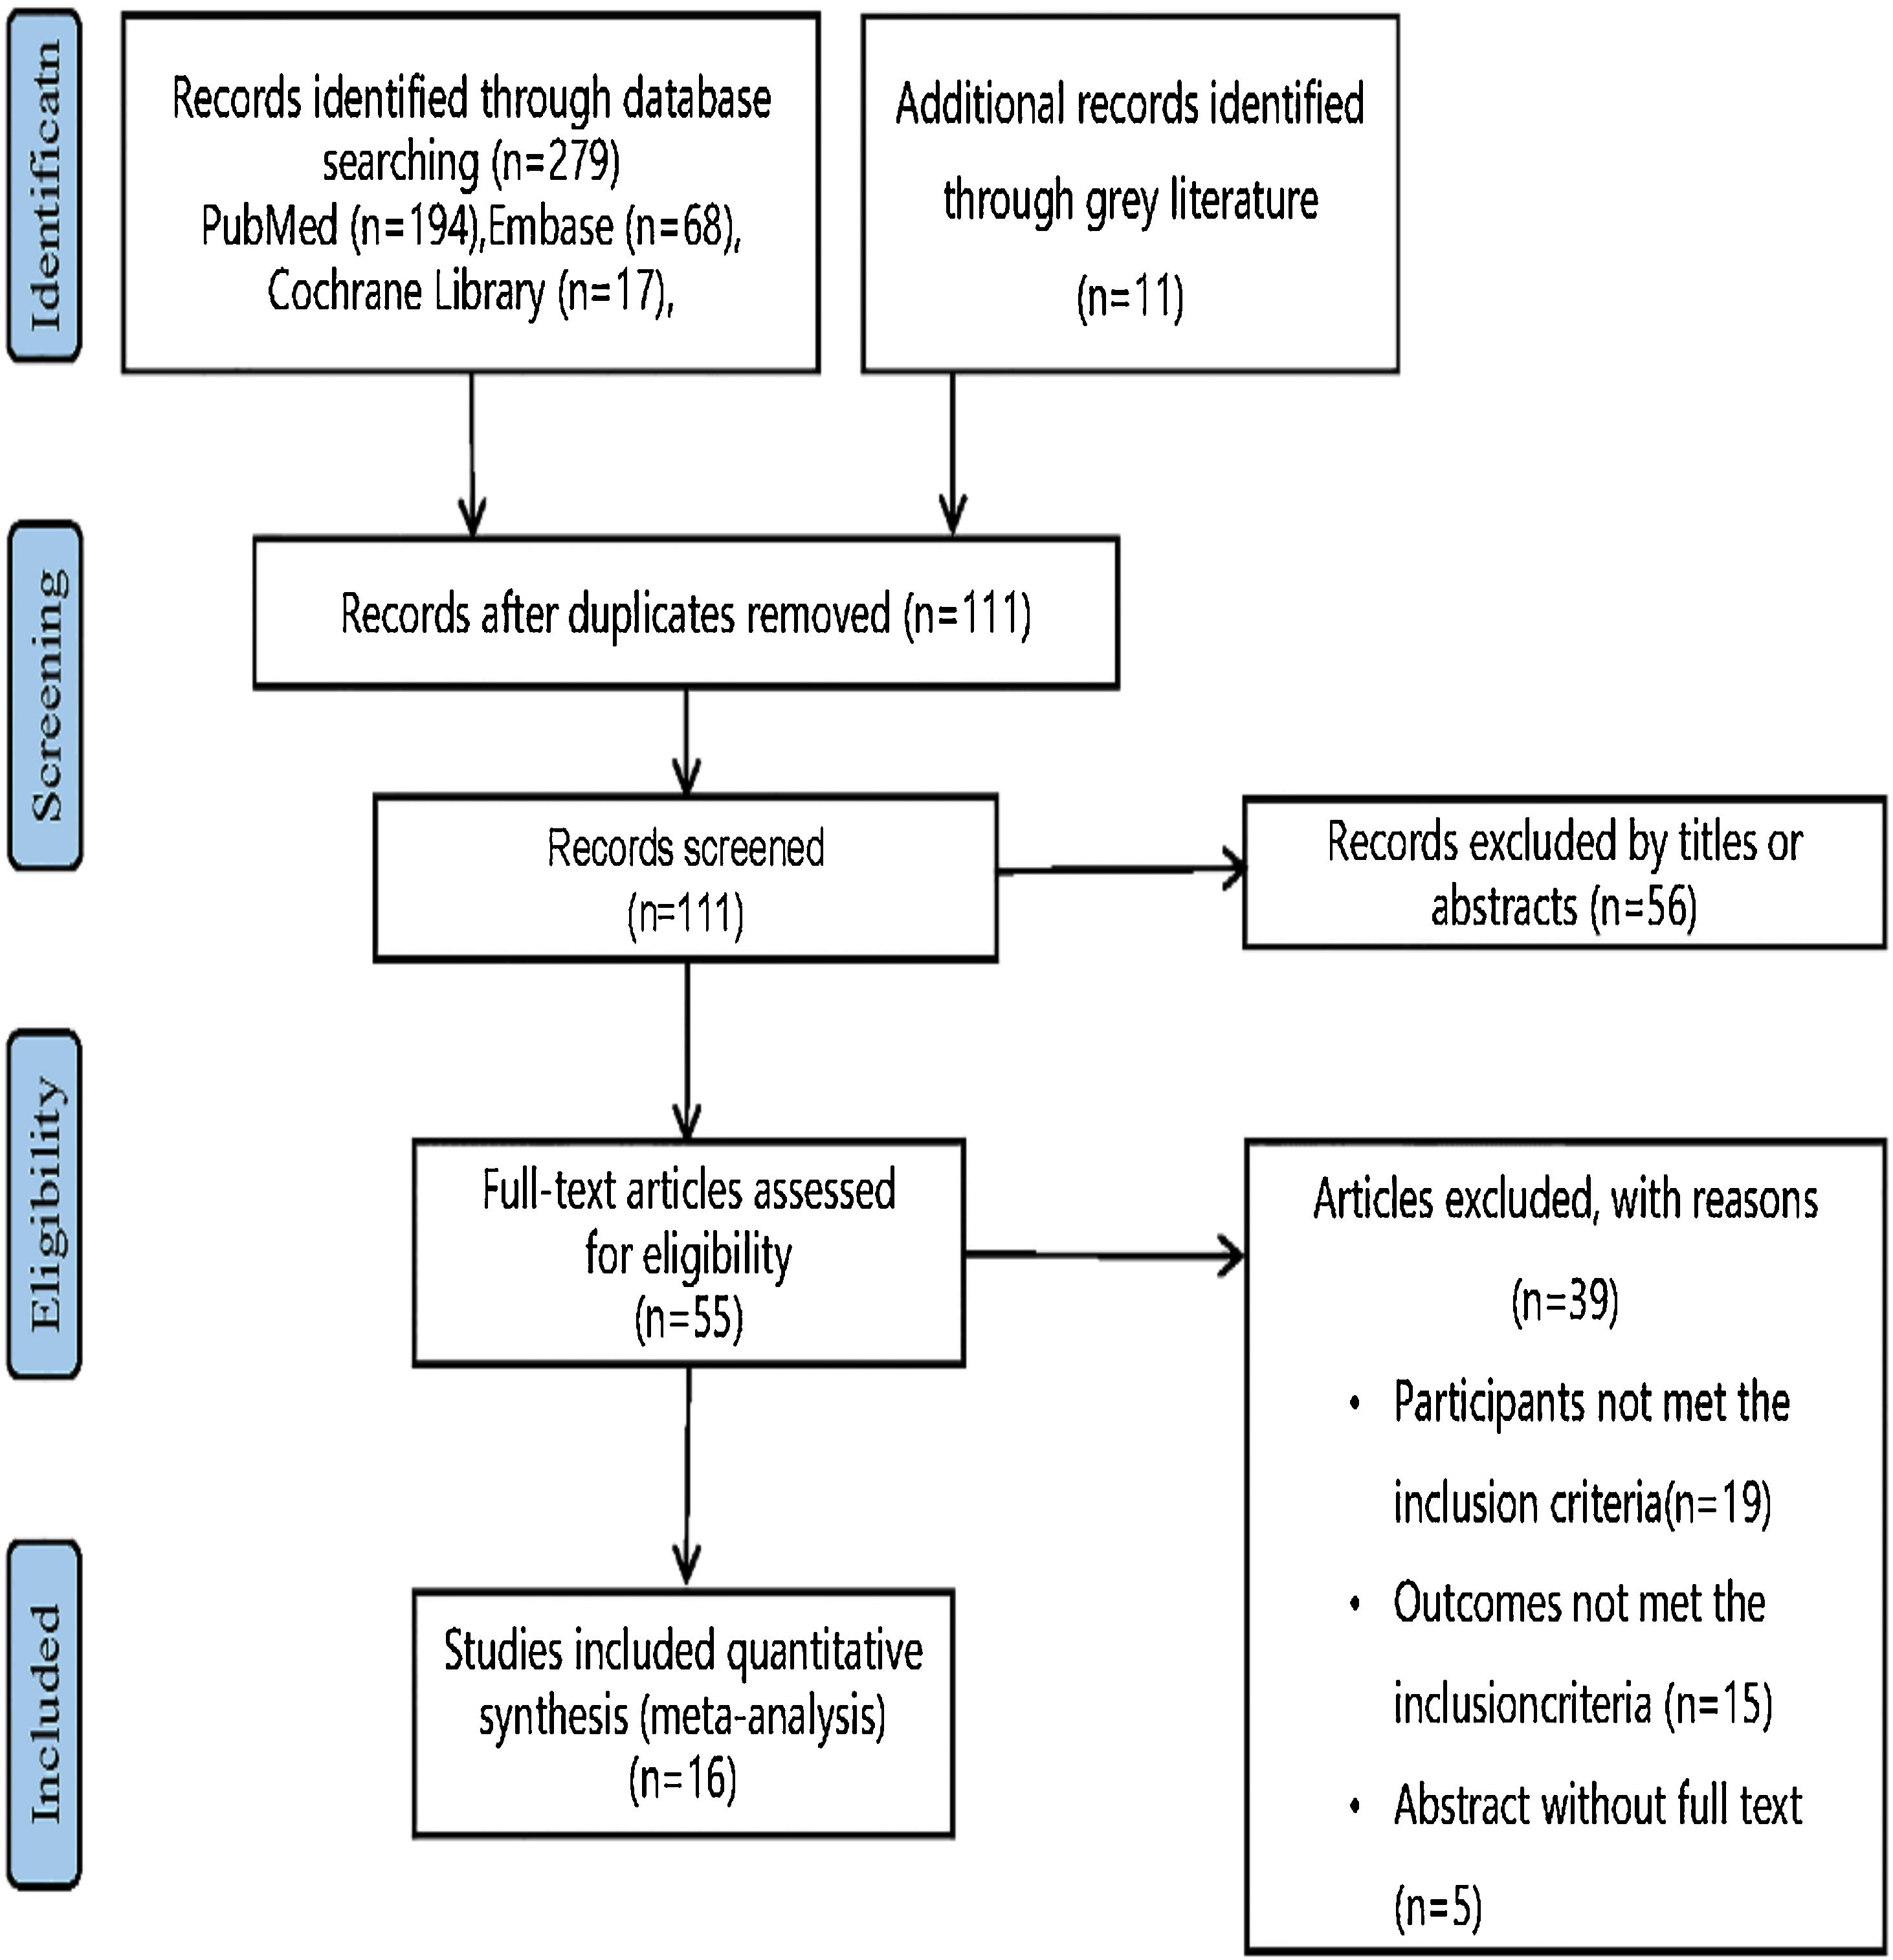
ResultsLiterature search and study selectionThe flow chart of study selection (Fig. 2) was established following the PRISMA guidelines.11 Specifically, 111 studies remained subsequent to the scrutiny of the titles and abstracts, among which 95 studies failed to satisfy the established criteria. As a consequence, 16 studies13,19–28 with 1,225 subjects fulfilled the criteria and were included in our systematic review and meta-analysis (Table 1).

Major characteristics of enrolled studies.
| Nº | Reference | Year | Country | Population | LPR/ Control | Control | Diagnostic criteria | Cut off (ng/mL) |
|---|---|---|---|---|---|---|---|---|
| 1 | Zhang13 | 2020 | Australia | Adult | 26/4 | OC | PH monitoring | 16/75 |
| 2 | Bozzani16 | 2020 | Italy | Adult | 76/59 | HC and OC | Symptoms | 25 |
| 3 | Klimara15 | 2019 | USA | Adult | 19/7 | OC | PH monitoring and symptoms, signs | / |
| 4 | Weitzendorfer14 | 2019 | Austria | Adult | 41/29 | OC | PH monitoring and symptoms, signs | 16/50/100/150/216 |
| 5 | Barona-Lleo17 | 2018 | Spain | Adult | 180/41 | HC | Symptoms | / |
| 6 | Fortunato18 | 2017 | USA | Paediatric | 20/113 | HC and OC | PH monitoring | 5/7/10/30/50 |
| 7 | Dy 19 | 2016 | USA | Paediatric | 24/26 | OC | PH monitoring | 74 |
| 8 | Yadlapati20 | 2016 | USA | Adult | 15/18 | HC | Symptoms | 16 |
| 9 | Hayat21 | 2015 | UK | Adult | 84/114 | HC and OC | PH monitoring and symptoms | 16/50/100/150/210 |
| 10 | Ocak22 | 2015 | USA | Adult | 18/2 | OC | PH monitoring | 16 |
| 11 | Spyridoulias(a)23 | 2015 | UK | Adult | 68/10 | OC | Symptoms | 16 |
| 11 | Spyridoulias(b)23 | 2015 | UK | Adult | 40/38 | OC | Signs | 16 |
| 12 | Hayat24 | 2014 | UK | Adult | 21/10 | HC | Symptoms | 25 |
| 13 | Saritas25 | 2012 | UK | Adult | 22/25 | OC | PH monitoring | 50 |
| 14 | Kim26 | 2008 | Korea | Adult | 9/39 | HC and OC | PH monitoring | / |
| 15 | Printza27 | 2007 | Greece | Adult | 9/2 | HC | Symptoms and signs | / |
| 16 | Potluri28 | 2003 | USA | Adult | 3/13 | OC | PH monitoring | / |
HC: healthy control; OC: otorhinolaryngological control.
These 16 studies were assessed with the QUADAS-212 (Fig. 1) and their risk of bias is presented in Figure 1. Consecutive LPR patients were included in 5 (31%) of the included studies, and no additional inappropriate exclusions occurred subsequent to the initial recruitment. The remaining 11 trials did not explicitly describe consecutive patient enrollment, so the potential bias in patient selection was unclear. In 9 (56%) of the studies, researchers conducting the index test (salivary pepsin) were blinded to the results of the reference principal test (pH monitoring or symptoms/signs). Imaging was evaluated with the double-blinding method in 9 (56%) of the studies. The risk of bias regarding the flow and timing of the index experiment and reference principle was unclear in 8 (50%) of the studies since these studies failed to definitively report successful investigation with index and reference experiments in all of the included patients. In most investigations, reference principles, index tests, and patient selection were observed to have minimal risk of bias in applicability.
Meta-analysis for diagnostic dataThe included 16 studies were pooled for diagnostic accuracy in the meta-analysis. The data in Figure 3a exhibited an overall specificity of 0.67 (95% CI 0.48‒0.81) and an overall sensitivity of 0.61 (95% CI 0.50‒0.71). Moreover, the AUC value was 0.67 (95% CI 0.63‒0.71) (Fig. 3b). Fagan plots manifested a PLR of 2 and a NLR of 0.58, with 65% and 37% of the posttest probability for PLR and NLR, respectively (Fig. 3d).
; the SROC curve of pepsin in saliva for laryngopharyngeal reflux patients (a) and Fagan plot evaluating the overall diagnostic value of pepsin in saliva for laryngopharynx.")
Of these 16 studies, the cutoff value of 16 ng/mL was utilized in six studies;13,14,20–23 and the cutoff value of 50 ng/mL was used in four studies.14,18,21,25 In addition, other used cutoff values were 25 ng/mL, 74 ng/mL, 75 ng/mL, 100 ng/mL, 150 ng/mL, 210 ng/mL, and 216 ng/mL. Table 2 demonstrates the results of the subgroup analysis for the pooled sensitivity and specificity of the cutoff values of pepsin at 16 ng/mL and 50 ng/mL.
Subgroup analysis of different cut off value.
| Cut off value | Sensitivity (95% CI) | Specificity (95% CI) | DOR (95% CI) | PLR (95% CI) | NLR (95% CI) | AUC (95% CI) |
|---|---|---|---|---|---|---|
| 16 | 0.70 (0.57‒0.80) | 0.50 (0.35‒0.65) | 2 (1–5) | 1.4 (1.0–1.9) | 0.61 (0.39‒0.94) | 0.63 (0.58‒0.67) |
| 50 | 0.57 (0.34‒0.78) | 0.76 (0.56‒0.88) | 4 (2–8) | 2.3 (1.5–3.7) | 0.57 (0.37‒0.86) | 0.73 (0.69‒0.76) |
The diagnostic analysis of the included 16 studies revealed significant heterogeneity (sensitivity: I2 = 86.09%, p = 0.00; specificity: I2 = 86.84%, p = 0.00). Meta-regression analyses were conducted to indicate that the sample was the source of heterogeneity. Subgroup analyses (Table 3) were performed based on sample sizes (≥30 vs. <30), diagnostic criteria (pH monitoring vs. symptoms/signs), cutoff values (16 ng/mL vs. others), and populations (adult vs. others). Heterogeneity was lower only when it was derived from the size and diagnostic criteria.
Meta-regression results of diagnostic value.
| Parameter | Study | Sensitivity | P1 | Specificity | P2 |
|---|---|---|---|---|---|
| Size | |||||
| ≥30 | 13 | 0.68 (0.60‒0.77) | 0.01 | 0.57 (0.40‒0.75) | 0.06 |
| <30 | 4 | 0.29 (0.10‒0.48) | 0.90(0.73–1.00) | ||
| Population | |||||
| Adult | 15 | 0.62 (0.51‒0.73) | 0.73 | 0.69 (0.50‒0.87) | 0.75 |
| Others | 2 | 0.53 (0.21‒0.85) | 0.63 (0.15–1.00) | ||
| Diagnostic criteria | |||||
| PH monitoring | 10 | 0.63 (0.49‒0.77) | 0.85 | 0.69 (0.48‒0.89) | 0.96 |
| Sympotms/signs | 7 | 0.59 (0.42‒0.76) | 0.64 (0.37‒0.91) | ||
| Cutoff value | |||||
| 16 ng/mL | 8 | 0.68 (0.54‒0.81) | 0.74 | 0.61 (0.35‒0.86) | 0.41 |
| Others | 9 | 0.54 (0.39‒0.70) | 0.72 (0.52‒0.93) |
Furthermore, the pooled results remained unchanged after any studies demonstrating the credibility of the results. The Deeks’ plot manifested the absence of publication bias (p = 0.24), (Fig. 3c).
DiscussionLPR is diagnosed by the results of 24 h Multichannel Intraluminal Impedance and pH (MII-pH) monitoring (a current gold standard), RFS, and RSI. Nevertheless, the symptoms reported in RSI (such as globus pharyngeus, cough, and hoarseness of voice) do not exhibit specificity to LPR and may indicate other laryngeal pathologies, as did endoscopic laryngopharyngeal findings in RFS. In addition, patient-reported symptomatology is inadequate to independently diagnose LPR.29 Although pharyngeal pH analysis alone is insufficiently sensitive, the 24 h hypopharyngeal-esophageal MII-pH probe is a highly specific test. This probe, however, is costly, invasive, and poorly tolerated by patients.30
LPR and Gastroesophageal Reflux Disease (GERD) are considered to be two different diseases, even though they can co-exist. In particular, LPR patients mainly present with laryngopharyngeal symptoms such as pharyngeal itching, burning, dryness, and pain sensation, while GERD patients are manifested by heartburn, nausea, dysphagia, cough, and atypical chest pain. In addition, GERD results from lower esophageal sphincter dysfunction and usually occurs in the supine position at night. Conversely, LPR, attributable to the upper gastroesophageal sphincter, frequently occurs in the upright position during the day, especially during intense physical activity. In terms of diagnosis, laryngoscopy is used for LPR and gastroscopy for GERD.
Clinical preferences comprise empirical treatment with a 3-month trial of medications and changes in diet and lifestyle, in which retrospective positive responses suggest LPR as a diagnosis based on patient symptoms, without a clear, reliable, and less invasive diagnosis. Nonetheless, little is known about the effect of PPI therapy on LPR.31,32 Moreover, long-term administration of PPIs triggers the following risks: osteopenia, chronic kidney disease, acute interstitial nephritis, drug interactions with hepatic drug metabolites, and collagenous colitis.7,33 Growing attention has been attracted to the formal diagnosis of LPR with less invasive and more cost-effective means before treatment.
In addition to the aforementioned experiments, LPR also can be diagnosed by detecting pepsin in saliva. Pepsin, an enzyme discovered in gastric juice, is activated by hydrochloric acid within pepsinogen. Of note, its presence in the upper digestive tract is merely interpreted by the occurrence of reflux.34 Pepsin is an active form of pepsinogen that is a peptidase enzyme secreted by the glandular cells (chief cells) of the stomach, which can digest proteins by hydrolyzing peptide bonds. Moreover, pepsin can damage the mucosal membranes of the structures it contacts when it leaks out of the stomach together with other gastric contents. Additionally, pepsin also causes damage to the epithelial barrier by digesting intercellular junctions (gap junctions). Hence, pepsin is a major cause of laryngopharyngeal mucosal damage caused by reflux35–37 and can be regarded as direct evidence of reflux.
The salivary pepsin test is expected to be a first-line screening test for the simplicity of saliva collection and the low-cost and noninvasive nature of salivary pepsin detection.29
The present study revealed that salivary pepsin had an AUC of 0.67 (95% CI 0.63‒0.71), a pooled specificity of 0.67 (95% CI 0.48‒0.81), and a pooled sensitivity of 0.61 (95% CI 0.50‒0.71), indicating that the diagnostic value of salivary pepsin is not as high as suggested in the available meta-analyses and may be concurrent with a structured questionnaire which demonstrated a sensitivity of 63% and a specificity of 67%.38 Although our results illustrated the low diagnostic accuracy of salivary pepsin, different cutoff values of pepsin in the recruited literature led to inconsistent diagnostic data. Consequently, the predictive value, specificity, likelihood ratio, and sensitivity of different cutoff values were analyzed in the current study. The results of the subgroup analysis elucidated that the 50 ng/mL cutoff value had superior diagnostic data were superior to 16 ng/mL. Thus, setting a higher cutoff value may contribute to higher specificity and then enhance diagnostic data.
The salivary pepsin concentration varies depending on the time of saliva collection during the day.39 Our data identified that the test on saliva collected at multiple time points might elevate diagnostic sensitivity as compared to the test on only a single pepsin sample. Young et al. confirmed that waking hours were the optimal time to measure the presence of salivary pepsin.39 Klimara et al. found that pepsin was detected most frequently in the morning samples.15 Hayat et al. reported that positive saliva samples were most likely to be obtained 1 h after dinner in both the control and patient groups.24 Overall, the sensitivity of the salivary pepsin test can be improved by increasing the frequency of sampling and sampling in the presence of symptoms. Further research should be performed to probe the role of repeated saliva samplings and the optimal cutoff point.
This meta-analysis, nevertheless, has several limitations. First, some of the literature published online may have been overlooked despite our maximum efforts to retrieve relevant literature. Second, the heterogeneity was high (sensitivity: I² = 86.09%, p = 0.00; specificity: I² = 86.84%, p = 0.00) in our study. More notably, although meta-regression analyses were carried out in the present study, we only found that the size of the study was a source of heterogeneity and did not identify other sources of heterogeneity. Third, the degree of blinding was insufficient in the included studies. Although blinding of therapists is difficult, blinding of participants and outcome evaluation are required to eliminate trial performance and evaluation bias. Fourth, the small sample size of the trials may have caused inefficient trials. Last, the included studies had variable cutoff values for pepsin, which may result in inconsistent diagnostic data. Therefore, our results need to be verified by additional high-quality studies with different cutoff values and larger sample sizes.
In summary, our meta-analysis unraveled that salivary pepsin had a low diagnostic value for LPR. Furthermore, the optimal cutoff point and repeated saliva sampling were capable of increasing the diagnostic value of salivary pepsin. Nevertheless, the salivary pepsin test has rarely been applied. In this context, in-depth research is merited to determine the optimal approach to detecting salivary pepsin for LPR diagnosis, thus providing a consensus regarding the best timing and minimal threshold for salivary pepsin.
ConclusionThe present review unveils that salivary pepsin has a low diagnostic value for LPR and that the cutoff value of pepsin at 50 ng/mL exhibits superior diagnostic accuracy. The diagnostic value of salivary pepsin might be affected by the established diagnostic criteria. Therefore, the effectiveness of salivary pepsin needs to be further evaluated by longer-term and more rigorous randomized controlled trials. Likewise, better salivary pepsin tests warrant further investigation for the diagnosis of LPR.
Conflicts of interestThe authors declare no conflicts of interest.


