
Traditional meta-analyses on the diagnostic accuracy of oral lesions have been conducted, but they were inherently limited to direct pairwise comparisons between a single method and a single alternative, while multiple diagnostic options and the ranking thereof were methodologically not possible.
ObjectiveTo evaluate the diagnostic values of various methods in patients with oral potential malignant disease by performing a network meta-analysis.
MethodsTwo authors independently searched the databases (MEDLINE, SCOPUS, the Cochrane Register of Controlled Trials, and Google scholar) up to June 2020 for studies comparing the diagnostic accuracy of various tools (autofluorescence, chemiluminescence, cytology, narrow band imaging, and toluidine blue) with visual examination or other tools. The outcomes of interest for this analysis were sensitivity, specificity, negative predictive value, positive predictive value and accuracy. Both a standard pairwise meta-analysis and network meta-analysis were conducted.
ResultsTreatment networks consisting of six interventions were defined for the network meta-analysis. The results of traditional meta-analysis showed that, among six methods, narrow band imaging showed higher sensitivity, specificity, negative predictive value, positive predictive value, and accuracy compared to visual examination. The results of network meta-analysis showed that autofluorescence, chemiluminescence, and narrow band imaging had higher sensitivity compared with visual examination, and that chemiluminescence and narrow band imaging had higher negative predictive value compared with visual examination. However, autofluorescence and chemiluminescence had lower specificity compared with visual examination. There were no significant differences in positive predictive value and accuracy among the six interventions.
ConclusionThis study demonstrated that narrow banding imaging has superiority in terms of sensitivity and negative predictive value compared with the other five tested agents.
Despite the remarkable development of surgical management and adjuvant therapies for oral squamous cell carcinoma, the prognosis of patients remains poor with no significant change in the 5-year survival rate for decades.1 Therefore, the importance of early detection before cancer progresses has been increasingly highlighted. Oral potential malignant disease (OPMD) has been consistently gaining evidence as a precancerous stage.2 Therefore, early detection of OPMDs plays an important role in improving prognosis. However, it relies solely on the clinician’s ability to distinguish these lesions from benign conditions. Because OPMD could be asymptomatic and may assume a benign clinical appearance, it could be difficult to distinguish from reactive or inflammatory conditions of the oral mucosa.3 Since histopathological examination of the biopsy specimen is the gold standard for diagnosing oral malignancy, its dependency on the clinical experience of the medical practitioner to differentiate cancerous lesions from benign lesions remains an important issue.4 Therefore, various techniques such as vital staining, light-based detection, optical diagnostic techniques, and oral cytology have been used to compensate for low clinician reliability; these techniques are aimed at facilitating the early diagnosis of oral cancer.3
Traditional meta-analyses on the adjunctive diagnostic accuracy of oral lesions have been conducted, but they were inherently limited to direct pairwise comparisons between a single method and a single alternative, while multiple diagnostic options and the ranking thereof were methodologically not possible. By contrast, a network meta-analysis (NMA) can be used to compare multiple treatment options simultaneously, as it combines all direct and indirect evidence from related studies. Moreover, NMA provides a ranking of the assessed treatment options, thus allowing clinicians to choose the most effective approach as determined statistically.5 In this review, we present the results of our NMA of the efficacy of six different adjunctive diagnostic tools used during oral lesions. The evidence-based data can simplify clinical decision-making for the diagnosis of patients with OPMD or cancerous lesions.
MethodsEthical considerationsThis review study did not treat human participants. Therefore, our Institutional Review Board waived the need for informed consent for this systematic review and meta-analysis.
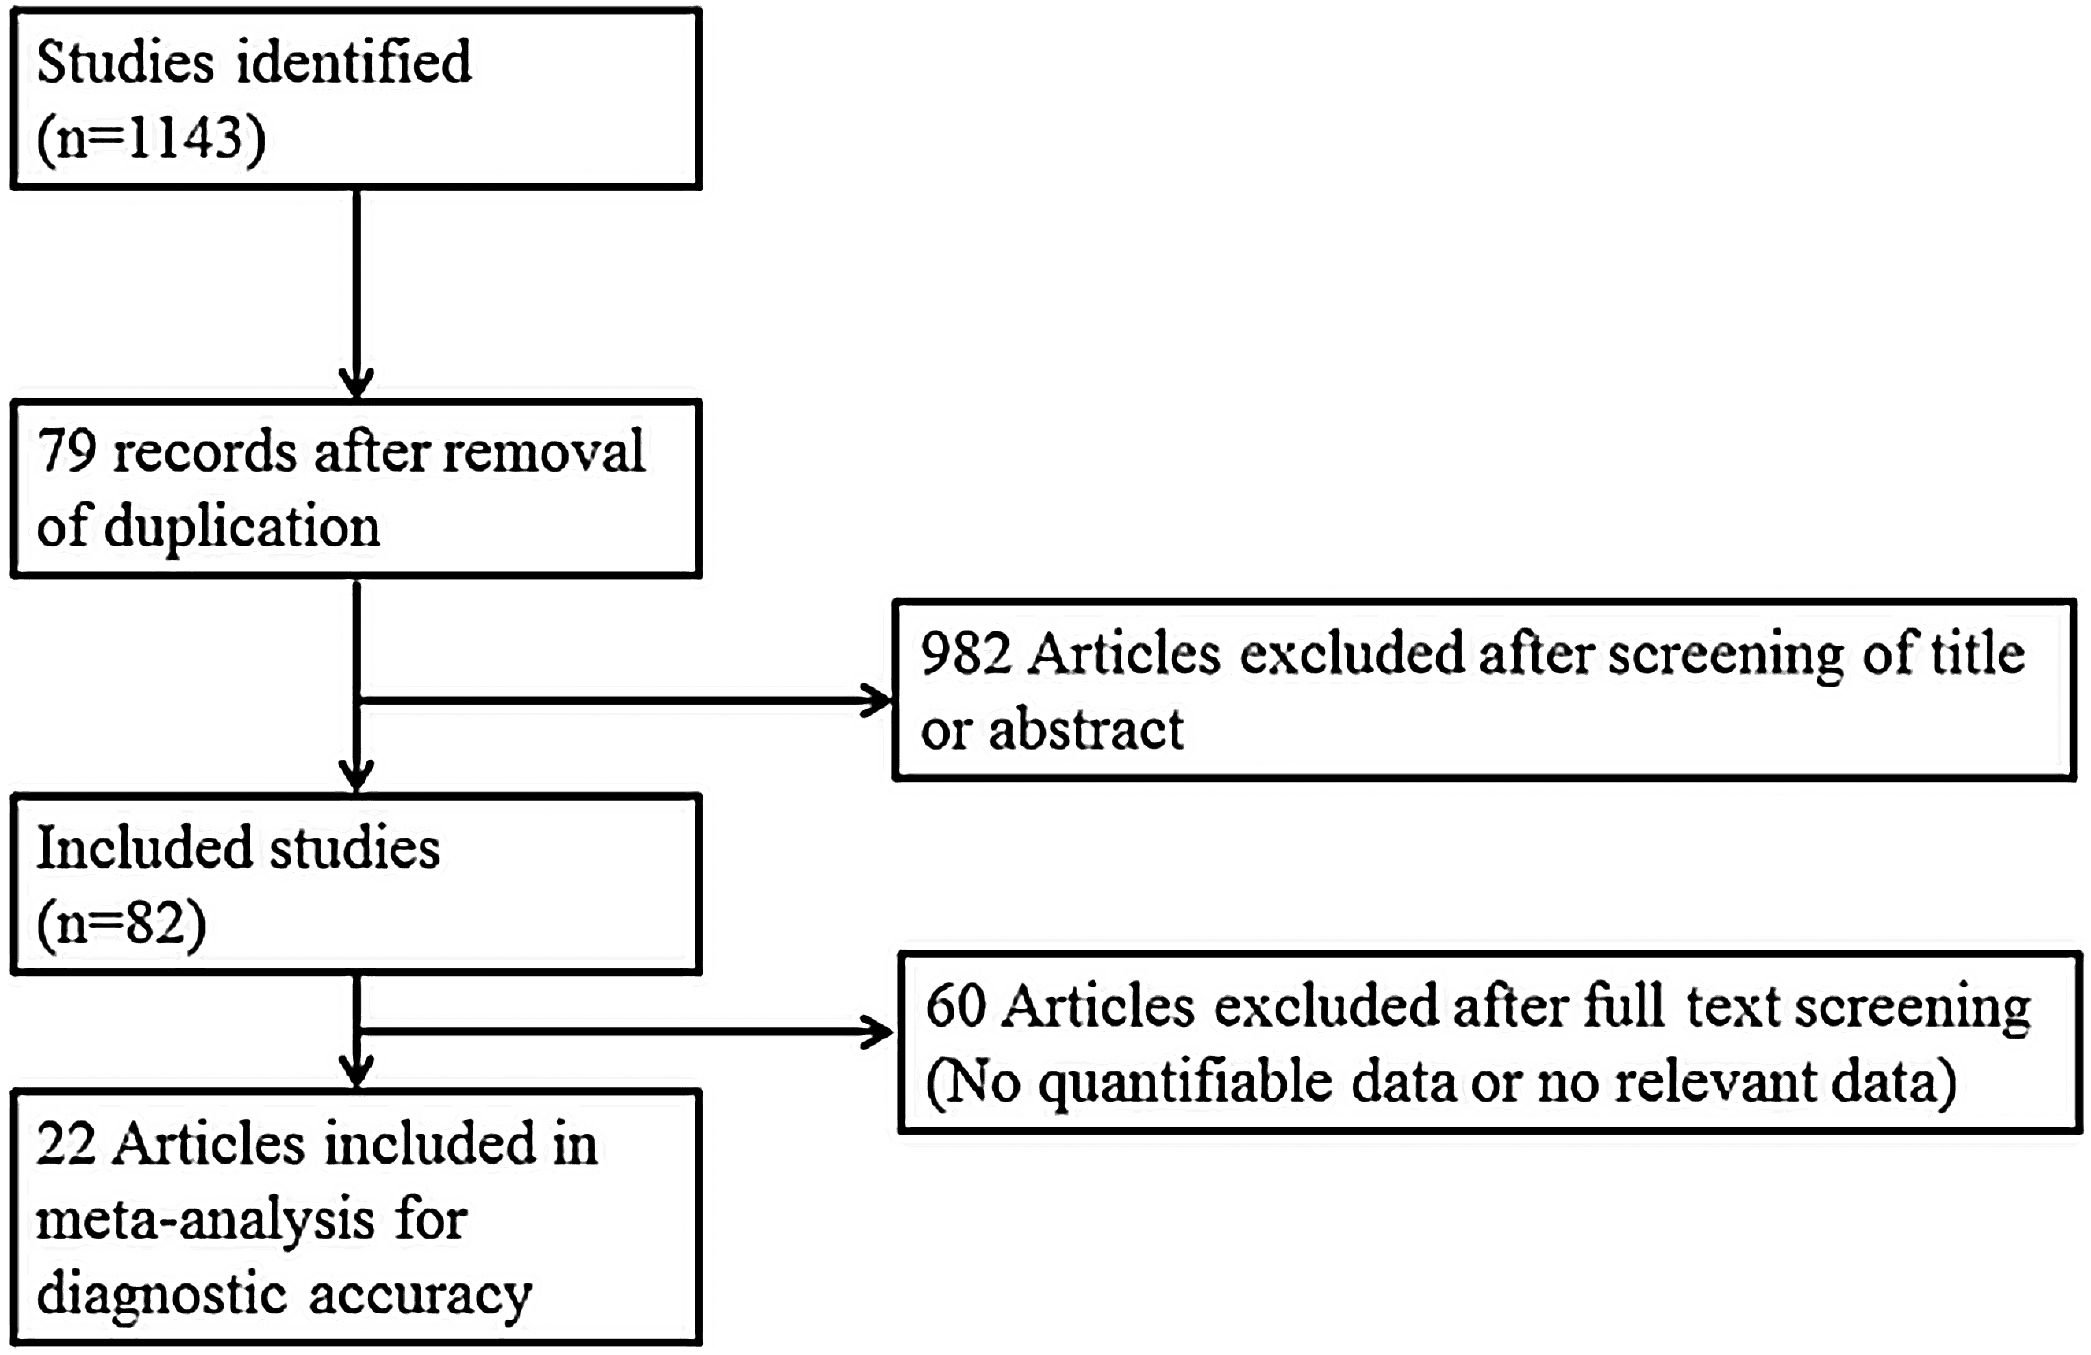
Search strategy and selection of studiesThe search strategy was designed and reviewed by a clinical librarian, an information specialist with 10 years of experience. Searching of the database including MEDLINE, Scopus, the Cochrane Register of Controlled Trials, and google scholar was performed in June 2020. We also checked the reference lists of included studies and existing systematic reviews to identify relevant articles. Strategies used are listed in Supplementary Tables 1 to 3, and diagrams of the study selection process are shown in Fig. 1. Overlapping or irrelevant studies were excluded by two independent reviewers screening titles and abstracts, and re-assessment of full texts of potentially eligible articles was also completed. Any discrepancy in the selection of literature was resolved by consensus or the third author.

The inclusion criteria were: 1) use of non-invasive adjunctive diagnostic tools (autofluorescence, chemiluminescence, cytology, narrow band imaging (NBI), and toluidine blue); 2) prospective or retrospective study protocol; 3) comparison of non-invasive adjunctive diagnostic tools with other tools or visual examination; and 4) sensitivity and specificity analyses. The exclusion criteria were: 1) case report format; 2) review article format; 3) diagnosis of other tumors (laryngeal cancer or nasal cavity tumors); and 4) lack of diagnostic data. Missing or incomplete data in the included studies were directly obtained from the authors. This NMA is based on the Preferred Reporting Items of Systematic Reviews and Meta-analyses for NMA.
Data extraction and risk of bias assessmentData extraction was performed from included studies using standardized forms by two authors independently. The evaluated outcomes consisted of sensitivity, specificity, negative predictive value, positive predictive value, and accuracy.2,6–33 Accuracy were calculated as (true-positives + true-negatives)/(true-positives + true-negatives + false-negatives + false-positive).34 The outcomes were compared with respect to the other diagnostic strategies and the visual examination. From all studies, data were collected regarding the number of patients, the true-positive, true-negative, false-positive, and false-negative values. Study quality was analyzed using the Quality Assessment of Diagnostic Accuracy Studies tool (ver. 2; QUADAS-2).
Statistical analysisMeta-analysis was performed using R 3.5.0 ‘netmeta’ package (R Foundation for Statistical Computing, Vienna, Austria). A random-effects NMA within a frequentist framework was conducted34 to achieve combined results in the form of odds ratio and 95% Confidence Intervals (95% CIs) for use across all studies to assess sensitivity, specificity, Negative Predictive Value (NPV), Positive Predictive Value (PPV), and accuracy.35 In all other cases, the outcomes of the incidence analysis were assessed using odds ratios. To rank treatment options graphically, the surface under the cumulative ranking curve (SUCRA) and mean ranks were adopted. SUCRA represents the probability of a treatment ranking best.36 In this study, SUCRA ranged from 0 to 1, with 1 indicating that the treatment option was statistically best and 0 the worst. Direct and indirect comparisons were adequately homogeneous. A loop-specific approach was used to distinguish heterogeneity in all triangular or quadratic loops in the NMA model.37 The discrepancy between direct and indirect evidence with the 95% CI was used to distinguish heterogeneity in all loops. Heterogeneity was defined as the difference between direct and indirect evidence with a 95% CI excluding 0. The node-splitting model was used to distinguish heterogeneity between the direct and indirect evidence.38 In addition, we made comparison-adjusted funnel plots to assess potential publication bias.39
ResultsThe literature review yielded 24 studies consisting of 1914 participants. Table 1 is the summary of study characteristics and bias assessment.
Summary of the studies included in the network meta-analysis.
| Study | Year | Nationality | Diagnostic standard of malignant or highly suspicous | Age | Number | Sex | Type | Lesion | Diagnostic modality |
|---|---|---|---|---|---|---|---|---|---|
| Allegra | 2009 | Italy | Invasive carcinoma or all dysplasia | 59 (42–82) | 32 | 19/13 | Pros | 45 | T vs. V |
| Amirchaghmaghi | 2018 | Iran | Invasive carcinoma or all dysplasia | 52.3 ± 14.8 | 45 | 21/24 | CS | 54 | A vs. V |
| Awan | 2015 | Pakistan | Invasive carcinoma or all dysplasia | NR | 116 | 65/51 | Pros | 116 | A vs. C vs. T |
| Chaudhry | 2016 | India | Invasive carcinoma or all dysplasia | 45 | 100 | 74/26 | Retro | 100 | C vs. T |
| Guneri | 2011 | Turkey | Invasive carcinoma or all dysplasia | NR | 35 | NR | Pros | 43 | T vs. A vs. cy |
| Hanken | 2013 | Germany | Invasive carcinoma or all dysplasia | 41–76 | 60 | 25/35 | Pros | 60 | A vs. V |
| Jayaprakash | 2009 | USA | Invasive carcinoma or all dysplasia | 59.8 (12.5) | 60 | 41/19 | Pros | 249 | V vs A |
| Kammerer | 2015 | Germany | Invasive carcinoma or all dysplasia (from moderate) | 60.4 | 44 | 25/19 | Pros | 50 | T vs. C vs. V |
| Mehrotra | 2010 | India | Invasive carcinoma or all dysplasia | 41 | 156 | 140/16 | CS | 156 | A vs. C |
| Mojsa | 2012 | Poland | Invasive carcinoma or all dysplasia | NR | 30 | NR | Pros | 41 | T vs. V |
| Petruzzi | 2014 | Italy | Invasive carcinoma or all dysplasia | 56.7 | 49 | 22/27 | Pros | 56 | A vs. T |
| Piazza | 2016 | Italy | Dysplasia (mild-moderate), CIS, Cancer | NR | 128 | NR | Pros | 128 | N vs. V |
| Piazza | 2010 | Italy | Dysplasia (mild-moderate), CIS, Cancer | 61.79 (35–86) | 96 | 58/38 | Pros | 96 | N vs. V |
| Rahman | 2012 | India | Invasive carcinoma or all dysplasia | 43 (26–60) | 86 | 68/18 | Pros | 86 | T vs. cy |
| Rajmohan | 2012 | India | Invasive carcinoma or all dysplasia | NR | 30 | NR | Pros | 30 | C vs. T |
| Ram | 2005 | Malaysia | Invasive carcinoma or all dysplasia | 35–80 (56.75) | 31 | NR | Pros | 31 | C vs. T |
| Rana | 2012 | Germany | Invasive carcinoma or all dysplasia | 62.5 ± 10.81 | 123 | 46/77 | CS | 123 | A vs. V |
| Roblyer | 2010 | USA | Invasive carcinoma or all dysplasia | NR | 72 | NR | Pros | 175 | C vs. V |
| Sharma | 2011 | India | Invasive carcinoma or all dysplasia | 44.34 ± 10.78 | 50 | 35/15 | Pros | 50 | C vs. TS vs. cy |
| Shukla | 2018 | India | Invasive carcinoma or all dysplasia | 21–60 | 42 | 37/5 | Pros | 42 | C vs. T |
| Simonato | 2017 | Brazil | Invasive carcinoma or all dysplasia | 52.13 | 15 | 11/4 | Pros | 15 | A vs. V |
| Simonato | 2019 | Brazil | Invasive carcinoma or all dysplasia | NR | NR | NR | Pros | 61 | A vs. V |
| Ujaoney | 2012 | India | Invasive carcinoma or all dysplasia | 44.4 (15) | 55 | 51/4 | Pros | 99 | C vs. T |
| Vashisht | 2014 | India | Invasive carcinoma or all dysplasia | NR | 35 | NR | Pros | 35 | C vs. T |
Pros, Prospective; Retro, Retrospective; CS, Cross-sectional NR, Not reported; V, Visual examination; A, Autofluorescence; C, chemiluminescence; cy, cytology; N, Narrow band imaging; T, Toluidine blue; TP, Ture positive; FP, False positive; FN, False Negative; TN, Ture negative.
Table 2 presents the traditional meta-analysis of different adjunctive diagnostic tools on the sensitivity, specificity, negative predictive value, positive predictive value, and accuracy.
Traditional meta-analysis of different diagnostic tools regarding sensitivity, specificity, negative predictive value, positive predictive value, and accuracy.
| Diagnostic methods | Sensitivity | Specificity | Negative predictive values | Positive predictive value | Accuracy |
|---|---|---|---|---|---|
| Autofluorescence (9 studies) | 0.8556 [0.7435; 0.9237 | 0.4882 [0.2871; 0.6933] | 0.8655 [0.7219; 0.9411], | 0.4933 [0.2699; 0.7194] | 0.6638 [0.5143; 0.7864]) |
| Chemiluminescence (11 studies) | 0.8750 [0.7586; 0.9397] | 0.5680 [0.2940; 0.8059] | 0.8338 [0.6994; 0.9154] | 0.6639 [0.3854; 0.8615] | 0.7452 [0.5981; 0.8518] |
| Cytology (3 studies) | 0.7212 [0.4517; 0.8904] | 0.8623 [0.7269; 0.9364] | 0.8491 [0.6478; 0.9451]] | 0.7509 [0.5296; 0.8898] | 0.8187 [0.6232; 0.9250] |
| Narrow band imaging (2 studies) | 0.9035 [0.8341; 0.9458] | 0.9480 [0.7571; 0.9907] | 0.9350 [0.6152; 0.9923] | 0.9364 [0.8725; 0.9694] | 0.9422 [0.8062; 0.9846] |
| Toluidine blue (14 studies) | 0.7142 [0.6069; 0.8018] | 0.8115 [0.6792; 0.8974] | 0.7078 [0.5299; 0.8389] | 0.8114 [0.7099; 0.8832] | 0.7585 [0.6641; 0.8330] |
| Visual examination (11 studies) | 0.7608 [0.6253; 0.8584] | 0.7952 [0.5930; 0.9119] | 0.8014 [0.6378; 0.9024] | 0.7671 [0.6140; 0.8722] | 0.8030 [0.7360; 0.8563] |
Autofluorescence results showed sensitivity: 0.8556 [0.7435; 0.9237], specificity: 0.4882 [0.2871; 0.6933], NPV: 0.8655 [0.7219; 0.9411], PPV: 0.4933 [0.2699; 0.7194]; and accuracy: 0.6638 [0.5143; 0.7864]). Overall, autofluorescence had high sensitivity and NPV poor specificity, PPV, and accuracy. Chemiluminescence showed sensitivity: 0.8750 [0.7586; 0.9397]; specificity: 0.5680 [0.2940; 0.8059]; NPV: 0.8338 [0.6994; 0.9154]; PPV: 0.6639 [0.3854; 0.8615]; and accuracy: 0.7452 [0.5981; 0.8518]]. Briefly, chemiluminescence showed similar adjunctive diagnostic power as autofluorescence. Toluidine blue results showed sensitivity: 0.7142 [0.6069; 0.8018]; specificity: 0.8115 [0.6792; 0.8974]; NPV: 0.7078 [0.5299; 0.8389]; PPV: 0.8114 [0.7099; 0.8832]; and accuracy: 0.7585 [0.6641; 0.8330]. Visual examination showed sensitivity: 0.7608 [0.6253; 0.8584]; specificity: 0.7952 [0.5930; 0.9119]; NPV: 0.8014 [0.6378; 0.9024]; PPV: 0.7671 [0.6140; 0.8722]; and accuracy: 0.8030 [0.7360; 0.8563]. Therefore, toluidine blue and visual examination showed similarly moderate adjunctive diagnostic power.
Cytology results showed sensitivity: 0.7212 [0.4517; 0.8904]; specificity: 0.8623 [0.7269; 0.9364]; NPV: 0.8491 [0.6478; 0.9451]; PPV: 0.7509 [0.5296; 0.8898]; and accuracy: 0.8187 [0.6232; 0.9250]. Therefore, cytology had high specificity and NPV. NBI showed sensitivity: 0.9035 [0.8341; 0.9458]; specificity: 0.9480 [0.7571; 0.9907]; NPV: 0.9350 [0.6152; 0.9923]; PPV: 0.9364 [0.8725; 0.9694]; and accuracy: 0.9422 [0.8062; 0.9846]. As a result, NBI had high values in all adjunctive diagnostic parameters. However, these two methods included few studies (two to three) in terms of adjunctive diagnostic accuracy, suggesting that our results should be interpreted with caution and further studies with more patients are required.
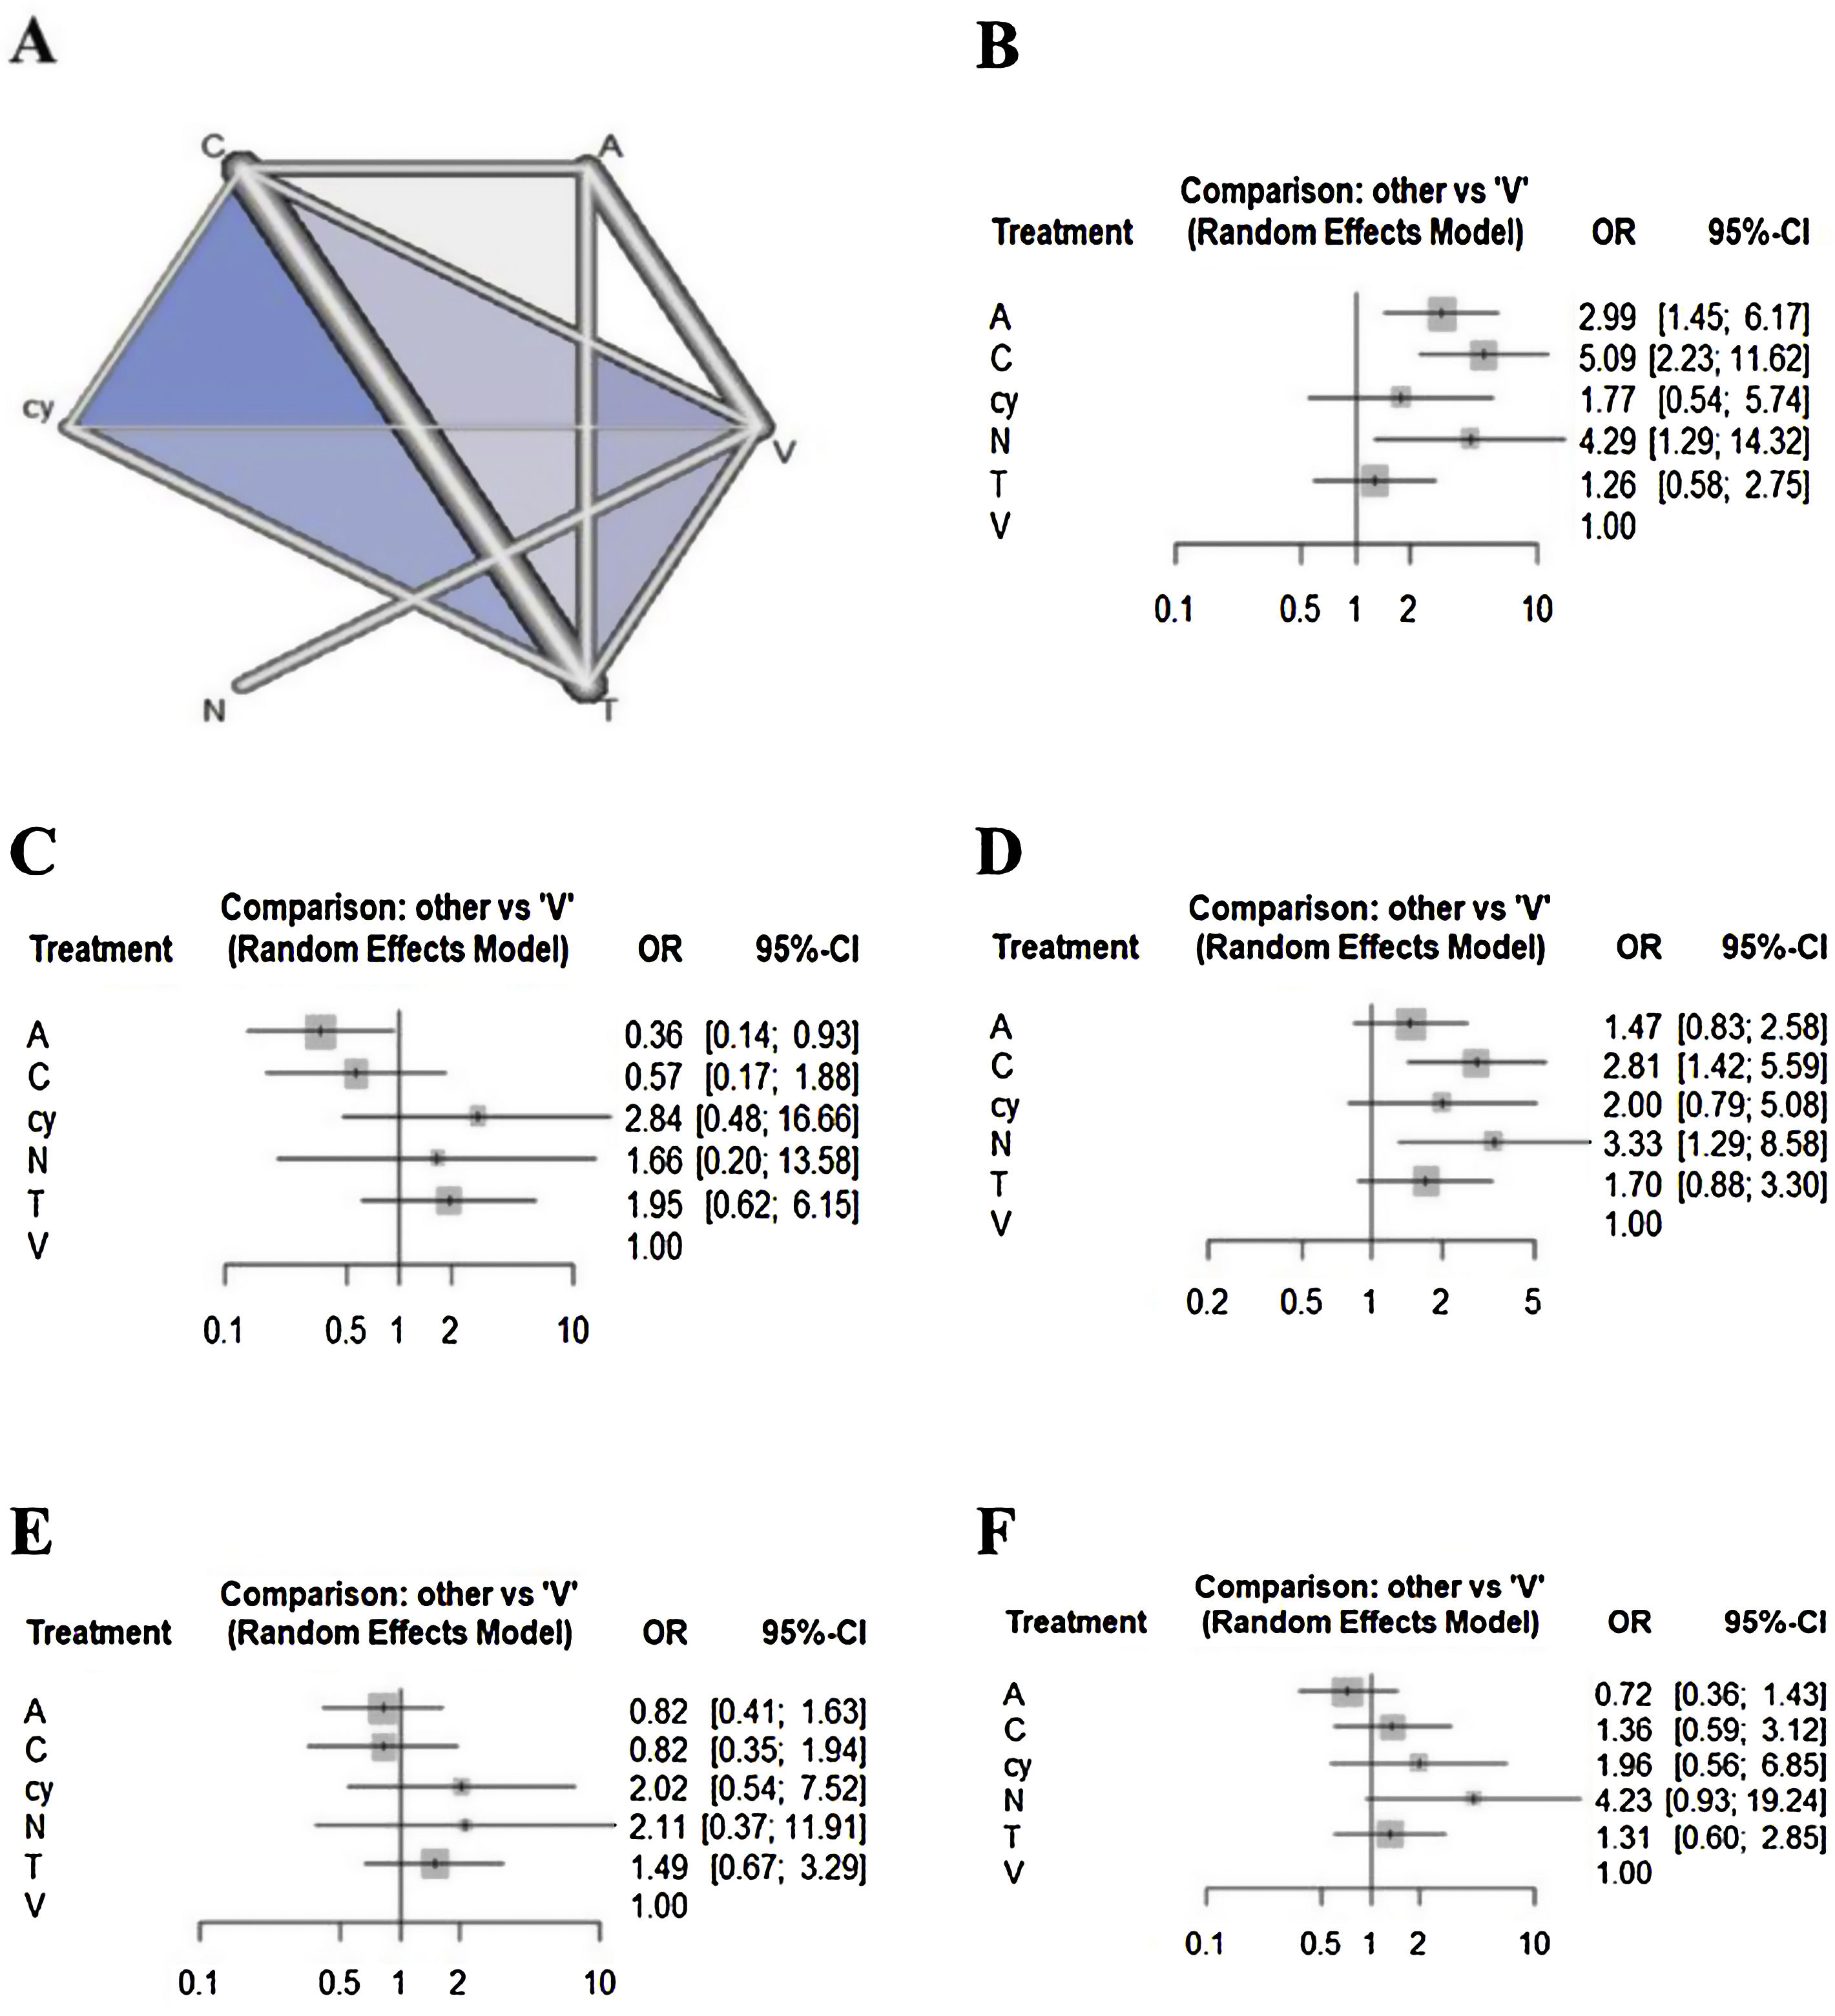
Network meta-analysisRegarding the outcome of sensitivity, chemiluminescence had the highest sensitivity compared with the visual examination (5.08 [95% CI 2.22 to 11.62]), followed by NBI (4.29 [95% CI 1.28 to 14.31]) and autofluorescence (2.98 [95% CI 1.44 to 6.17]). There were no significant differences between cytology, toluidine blue, and visual examination (Fig. 2). In terms of specificity, autofluorescence had the lowest specificity compared with visual examination (0.36 [95% CI 0.14 to 0.93]). Although chemiluminescence tended to be less specific compared to visual examination (0.57 [95% CI 0.17 to 1.88]), there were no significant differences in specificity among the other methods, including chemiluminescence. In terms of NPV, although all methods tended to have higher negative predictive value compared to visual examination, only chemiluminescence (2.81 [95% CI 1.41 to 5.59)]) and NBI (3.32 [95% CI 1.28 to 8.58]) showed a significant difference. In terms of PPV, although autofluorescence (0.81 [95% CI 0.41 to 1.63)]) and chemiluminescence (0.82 [95% CI 0.34 to 1.93)]) tended to have lower positive predictive value versus visual examination, there were no significant differences in specificity among all methods. In terms of accuracy, autofluorescence (0.7179 [95% CI 0.3597to 1.4327)]) tended to be less accurate and cytology (1.9591 [95% CI: 0.5604 to 6.8491)]) and NBI (4.2276 [95% CI 0.9287 to 19.2444)]) tended to be more accurate compared to visual examination. However, there were no significant differences in accuracy among all methods.
 and forest plots (B–F) for the network meta-analysis. Lines indicate direct comparisons in the eligible studies (A). The odds ratio of diagnostic accuracy is shown (B–F).")
An evaluation of whether the direct and indirect comparisons were sufficiently similar in the NMA showed no global inconsistencies regarding sensitivity (p = 0.3878), specificity (p = 0.2333), NPV (p = 0.9884), PPV (p = 0.4254), or accuracy (p = 0.7371). Additionally, there were no local inconsistencies among outcomes (supplementary Tables 4 to 8).
Results of the ranking hierarchyThe SUCRA values of the six adjunctive diagnostic methods were summarized and shown in Table 3. Considering the overall adjunctive diagnostic parameters, autofluorescence showed lower SUCRA values (sensitivity: 63.95%; specificity: 6.83%; NPV: 31.89%; PPV: 22.20%; accuracy: 8.01%). NBI showed higher SUCRA values (sensitivity: 77.91%; specificity: 63.78%; NPV: 83.54%; PPV: 72.52%; accuracy: 90.82%).
Ranked probabilities of the effectiveness of different diagnostic tools on sensitivity, specificity, negative predictive value, positive predictive value, and accuracy.
| Treatment | Sensitivity | Specificity | NPV | |||
|---|---|---|---|---|---|---|
| SUCRA | Rank | SUCRA | Rank | SUCRA | Rank | |
| Visual examination | 0.0920 | 6 | 0.4745 | 4 | 0.0460 | 6 |
| Autofluorescence | 0.6395 | 3 | 0.0683 | 6 | 0.3189 | 5 |
| Chemiluminescence | 0.8923 | 1 | 0.2382 | 5 | 0.8264 | 2 |
| Cytology | 0.3893 | 4 | 0.8346 | 1 | 0.5534 | 3 |
| Narrow band imaging | 0.7791 | 2 | 0.6378 | 3 | 0.8354 | 1 |
| Toluidine blue | 0.2078 | 5 | 0.7465 | 2 | 0.4200 | 4 |
| Treatment | PPV | Accuracy | ||
|---|---|---|---|---|
| SUCRA | Rank | SUCRA | Rank | |
| Visual examination | 0.3800 | 4 | 0.2974 | 5 |
| Autofluorescence | 0.2220 | 6 | 0.0801 | 6 |
| Chemiluminescence | 0.2223 | 5 | 0.5220 | 3 |
| Cytology | 0.7752 | 1 | 0.7017 | 2 |
| Narrow band imaging | 0.7252 | 2 | 0.9082 | 1 |
| Toluidine blue | 0.6753 | 3 | 0.4906 | 4 |
SUCRA, surface under the cumulative ranking curve; PPV, positive predictive value.
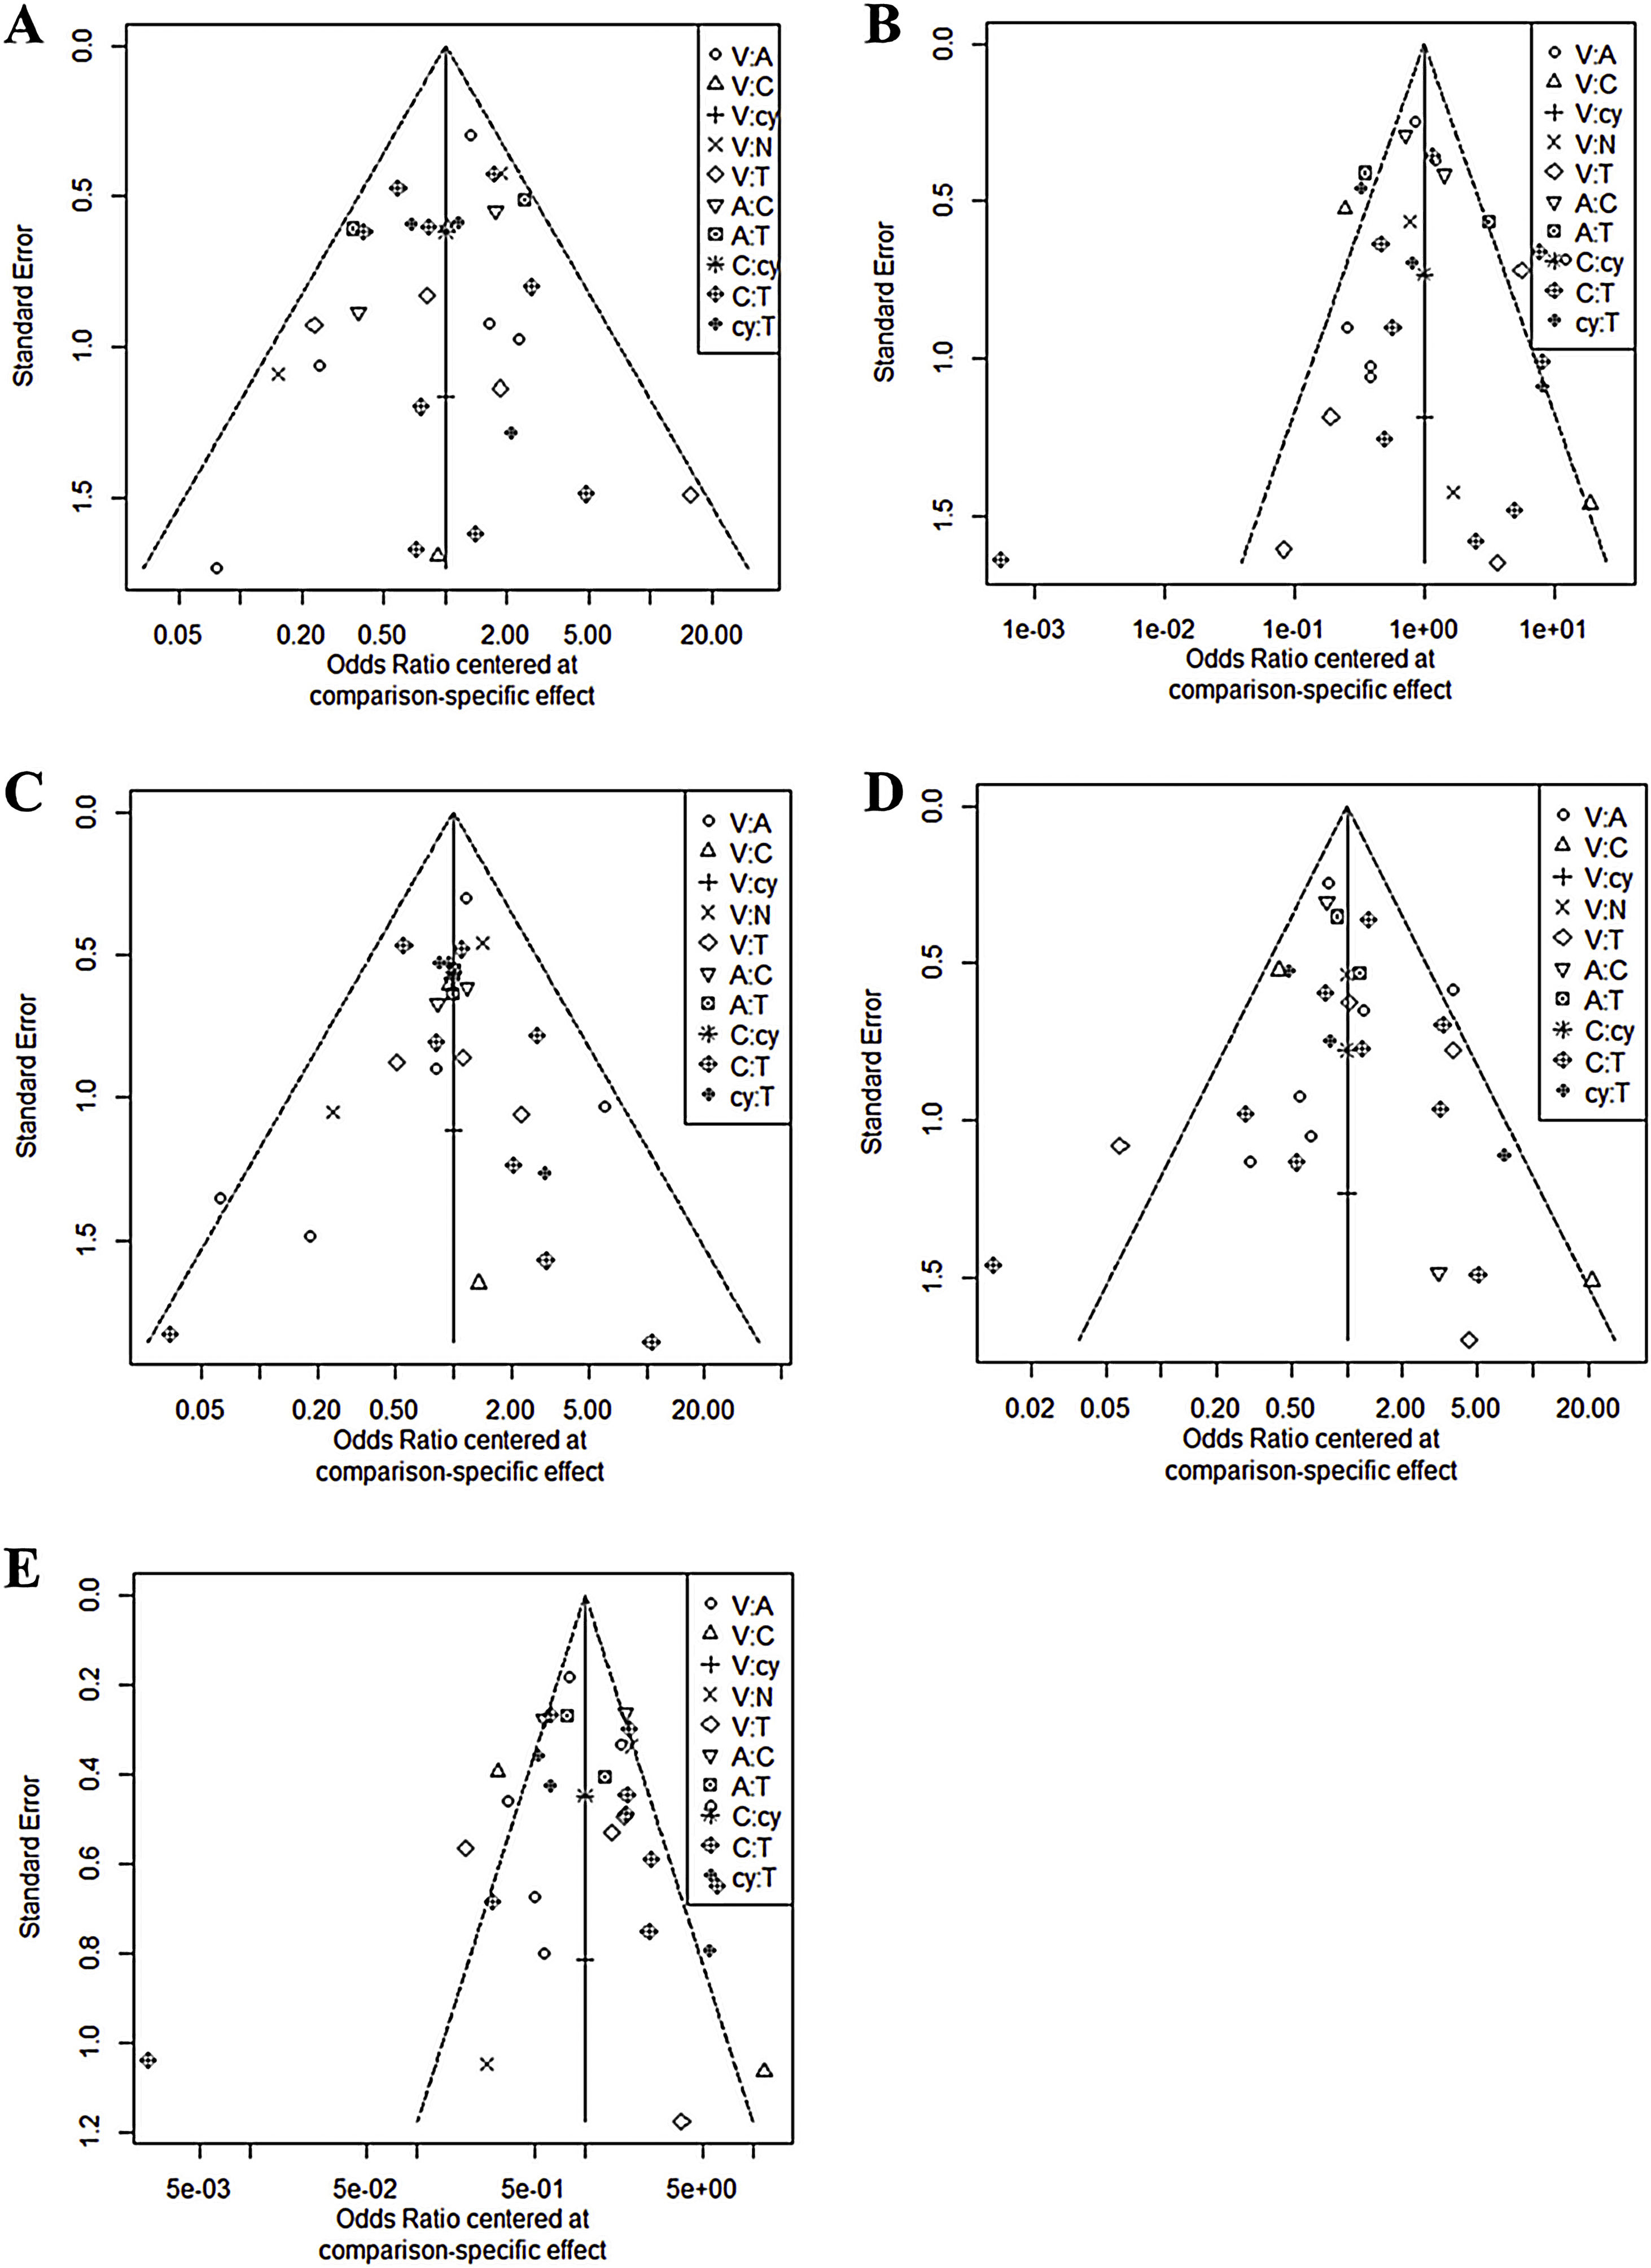
In all six comparison-adjusted funnel plots (Fig. 3), scatters of the same symbols were visually symmetrical, which meant that publication bias was relatively low for sensitivity, specificity, negative predictive value, positive predictive value, and accuracy. Linear regression test of funnel plot asymmetry also showed no significant publication bias (p > 0.05).
Discussion
Conventional visual assessment and tactile examination of the oral cavity remains the gold standard for the identification of oral mucosal lesions.15 However, an adjunctive method to detect OPMD has been reported showing a proper diagnostic yield.25 Therefore, our network conducted meta-analysis of those new studies, and included detailed comparisons of other adjunctive diagnostic tools with conventional visual examination. Previous meta-analyses or systemic reviews have documented the efficacy of several adjunctive diagnostic tools in detecting OPMD or cancerous lesions early and improving the survival rate for oral cancer.40 However, the limitations of these studies hindered their clinical relevance, as they consisted of separate diagnostic meta-analysis or descriptive reviews without statistical analysis; they could not assess multiple treatments or provide a ranking of their effectiveness.35 This makes it difficult for clinicians to select the optimal method among several methods demonstrated to be effective in previous meta-analyses or systemic reviews.
NMA is a novel analytic approach that enables simultaneous comparisons of multiple interventions. It also allows quantitative comparisons of treatments that previously had not been compared directly using direct and indirect data and combinations of evidence from different dimensions.5 This study used NMA to resolve the limitations of previous studies of adjunctive diagnostic methods for oral pre- or cancerous lesions that examined single, rather than multiple, treatment options or describe the systemic reviews without the presentation of objective values. Specifically, we conducted a systematic review using NMAs to rank the effects of five adjunctive diagnostic methods and visual examination used to detect the OPMD.
Regarding the five adjunctive diagnostic methods, in the autofluorescence method, the tissue autofluorescence produced by submucosal healthy tissues can be detected by fluorescence spectroscopy.21 Loss of autofluorescence occurs in OPMD due to biochemical changes of epithelial cells, inflammatory process, and angiogenesis occurred from the early neoplastic process.41 The optimum excited violet light of 400 nm has been verified to stimulate the oral mucous membrane which can be observed as “apple-green” light through optical filters. Lesion would be observed in well-demarcated dark areas due to the loss of tissue autofluorescence.41 The chemiluminescence method uses specific wavelengths that are absorbed by normal cells and reflected off abnormal cells due to their nuclear cytoplasmic ratio. Therefore, atypical mucosal abnormalities appear bright white.25 The NBI evaluates tissue characteristics using narrow-bandwidth filters that share absorption peaks with hemoglobin. This method uses blue and green light to reveal the blood vessels of the superficial mucous membrane and submucosa, enabling the detection of superficial and abnormal mucosal lesions.42 Toluidine blue is the most commonly used and widely studied vital staining technique. It is a dye with high affinity for acidic components and stains tissues with rich nucleic acids. Dysplastic or neoplastic cells contain wider intracellular canals compared to normal cells facilitating penetration of the dye. Oral exfoliative cytology has been used since the 1950s to collect epithelial cells for morphologic evaluation under the light microscope. With exfoliative cell collection using a bristle brush (brush cytology), full thickness epithelium including basal epithelial cells can be obtained. It is known to be a well-tolerated method that reduces the need for unnecessary surgical biopsies in clinically benign lesions.17
Autofluorescence and chemiluminescence showed higher sensitivity but lower specificity. These results indicate that there would be no difference between these light-based detection methods and clinical examination when evaluating obvious neoplastic lesions; however, when clinical examination yields negative neoplastic findings, these methods are more sensitive for identifying suspicious lesions. The high sensitivity of these methods can be attributed to the increased brightness and clarity of oral lesions, which could support the idea that these devices can detect new lesions and reveal tumor margins.15 Thus, these devices would be more effective than clinical examination in identifying non-symptomatic and clinically obscure lesions.15,26
However, the pooled specificities were lower compared with those for clinical examination, mostly due to the false-positive results obtained with these devices. Thus, these may be useful for identifying all lesion types, but might be not reliable for distinguishing benign oral lesions from dysplasia or squamous cell carcinoma.43 The poor specificity could be explained by the mechanism of autofluorescence and chemiluminescence.19,44 For chemiluminescent mixtures, we included an acetic acid pre-rinse to remove debris and glycoprotein layers, thereby increasing penetration and light reflection. However, acetic acid causes cell dehydration and protein coagulation, which reduces epithelial transparency. This reduced transparency could cause the aceto-white appearance of white lesions.44 Additionally, the use of an acetic acid pre-rinse could stimulate salivary gland secretion. This result in significant mucosal surface reflectivity could make it difficult to identify lesion boundaries.11
The high false-positive rate raised concerns of its potential risks, such as causing unnecessary stress and fear in patients, as well as increased morbidity due to surgical procedures for unnecessary biopsies.19 In addition, chemiluminescence screening has several limitations, such as the necessity of a dark environment, high cost, absence of a permanent record (except for photographs), and inability to measure visualization results objectively.45 The results of the present study also suggest that these methods could not provide a substitute for clinical examination of malignant and potentially malignant lesions in the oral mucosa.
The diagnostic accuracy of toluidine blue and oral exfoliative cytology tended to be higher than clinical examination, but there were no significant differences. In addition, the Material Data Safety Sheet indicates that toluidine blue could have hazardous effects if swallowed.46 Toluidine blue is not only expensive but also has relatively toxic effects on fibroblasts, inducing mutagenesis of stained cells under high energy irradiation.47 Oral exfoliative cytology also adds to the cost and delays the definite diagnosis.48 Therefore, the results of this meta-analysis indicate that these methods would not have additional advantages over their disadvantages and, thus, not constitute a convenient replacement for conventional screening tests that use standard overhead light.
In our study, NBI was in the top 3 in all diagnostic accuracy parameters. NBI would improve diagnostic sensitivity of a conventional endoscopic examination to assess tissue characteristics using narrow bandwidth filters with absorption peaks in hemoglobin. The NBI uses two light spectrums (blue and green), which can display blood vessels in superficial mucosa and submucosal areas. NBI could differentiate superficial mucosal lesions not detected under standard white light imaging endoscopy making it a useful tool for precise pathologic diagnosis and early diagnosis of oral premalignant or cancerous lesions.
There were some limitations to this study. There may be significant limitations for generalization due to the very small numbers of enrolled studies (from two studies). Second, although there have been two methods including mucosal patterns (well-demarcated brownish areas)24,49 and vascular pattern (IPCL classification)49,50 for discriminating pathologic lesions from benign mucosal lesions, only mucosal patterns (well-demarcated brownish areas) were included to compare the utility of NBI for aiding the detection of OPMD and malignant lesions in the oral cavity. In the view of these limitations, we need to include more reports with standardized assessment method in future studies to support or generalize our positive results for NBI. Third, since this article has judged based on one criterion (diagnostic accuracy), the clinically important values each of five adjunctive diagnostic tools has can be neglected.
Our results suggest that the current non-invasive adjunctive methods (except NBI) to detect OPMD might not improve the diagnostic accuracy compared to conventional examination. However, autofluorescence, chemiluminescence, and NBI are useful for mass screening and enable more accurate real-time optical diagnoses. Toluidine blue could make the biopsy site more clear for ambiguous lesions. Cytology could help determine whether real biopsy is necessary in patients with contraindications to surgical procedures, is useful for performing cell type evaluation on the oral epithelium itself and could be useful when it is difficult to construct a population screening setting. Therefore, in determining whether to use these adjunctive diagnostic tools, clinical situations should be carefully considered. Although NBI would be a good tool for adjunctive diagnosis of OPMD, more studies with standardized diagnostic criteria are required to support the usefulness of NBI.
ConclusionThe results of our NMA showed that only NBI would be useful for detecting OPMD. The other methods (autofluorescence, chemiluminescence, cytology, and toluidine blue) have little benefit compared to conventional examination. In view of their cost and adverse effects, these methods would be not recommended as adjunctive diagnostic tools. For the utilization of NBI, further studies with standardized assessment method are required to support our results.
FundingThis research was supported by the Basic Science Research Program through the National Research Foundation of Korea (NRF) funded by the Ministry of Education (2020R1I1A1A01051844, 2018R1D1A1B07045421), the Bio & Medical Technology Development Program of the National Research Foundation (NRF) funded by the Ministry of Science & ICT (2018M3A9E8020856, 2019M3A9H2032424, 2019M3E5D5064110), and the Korea Health Industry Development Institute funded by the Ministry of Health and Welfare (HI14C3228). The sponsors had no role in the study design, data collection and analysis, decision to publish, or preparation of the manuscript.
Conflicts of interestThe authors declare no conflicts of interest.
The following is Supplementary data to this article:
Peer Review under the responsibility of Associação Brasileira de Otorrinolaringologia e Cirurgia Cérvico-Facial.


