
The clinical evaluation of subjects with occupational noise exposure has been difficult due to the discrepancy between auditory complaints and auditory test results. This study aimed to evaluate the contralateral acoustic reflex thresholds of workers exposed to high levels of noise, and to compare these results to the subjects’ auditory complaints.
MethodsThis clinical retrospective study evaluated 364 workers between 1998 and 2005; their contralateral acoustic reflexes were compared to auditory complaints, age, and noise exposure time by chi-squared, Fisher's, and Spearman's tests.
ResultsThe workers’ age ranged from 18 to 50 years (mean=39.6), and noise exposure time from one to 38 years (mean=17.3). We found that 15.1% (55) of the workers had bilateral hearing loss, 38.5% (140) had bilateral tinnitus, 52.8% (192) had abnormal sensitivity to loud sounds, and 47.2% (172) had speech recognition impairment. The variables hearing loss, speech recognition impairment, tinnitus, age group, and noise exposure time did not show relationship with acoustic reflex thresholds; however, all complaints demonstrated a statistically significant relationship with Metz recruitment at 3000 and 4000Hz bilaterally.
ConclusionThere was no significance relationship between auditory complaints and acoustic reflexes.
A avaliação clínico-ocupacional de trabalhadores expostos a ruído é dificultada pela discrepância entre queixas auditivas e resultados dos exames audiológicos. Este estudo pretende avaliar limiares dos reflexos estapedianos contralaterais em sujeitos expostos a níveis elevados de pressão sonora, relacionando-os com queixas auditivas.
MétodoEstudo clínico retrospectivo que analisou 364 trabalhadores e seus limiares de reflexos estapedianos contralaterais, relacionado-os com queixas auditivas, idades e tempos de exposição ao ruído.
ResultadosDos trabalhadores avaliados, com idades de 18 a 50 anos (média 39,6) e tempos de exposição entre um e 38 anos (média 17,3); 15,1% (55) tinham queixa de perda auditiva bilateral, 38,5% (140) zumbidos bilaterais, 52,8% (192) irritação ao ouvir sons intensos e 47,2% (172) dificuldades para reconhecer a fala. As variáveis: perda auditiva, dificuldade para reconhecimento da fala, zumbidos, faixa etária e tempo de exposição ao ruído não se relacionaram significativamente com limiares dos reflexos estapedianos, mas todas as queixas apresentaram relação estatisticamente significante com o recrutamento de Metz nas frequências de 3000 e 4000Hz, bilateralmente.
ConclusãoNão houve relações significativas entre limiares dos reflexos estapedianos e queixas auditivas.
Noise-induced hearing loss (NIHL) is characterized by a gradual loss of hearing acuity, resulting from a continuous exposure to high sound pressure levels.
The principal characteristic of NIHL is an irreversible sensorineural hearing loss that is usually bilateral. Initially, the clinical picture involves auditory thresholds of one or more frequencies between 3000 and 6000Hz, forming a characteristic notch. The highest and lowest frequencies may take longer to be affected. There is variability in pattern of evolution for the NIHL due to individual susceptibility, that is more pronounced in the first 10–15 years of exposure, decreasing and tending to stabilize thereafter.1
Histological studies in humans have shown that the more damaged cochlear sensory cells in patients with NIHL correspond to the frequency range of 3000–6000Hz in the basal turn of the cochlea, about 8–14mm from the oval window. The changes caused by noise exposure vary, from minor changes in hair cells to the complete absence of the spiral organ.1,2
Because this is a predominantly cochlear disorder, the individual affected by NIHL may exhibit reduced hearing, oversensitivity to loud sounds and tinnitus, as well as impairment of speech intelligibility, especially in situations with competing noise. It is important to remember that retrocochlear diseases most commonly affect speech intelligibility.3
However, exposure to noise also can cause important psychosocial changes in workers, affecting their quality of life, such as stress, anxiety, and impairment in social relations, as well as activities of daily living.2
The diagnosis of NIHL can only be established through a set of evaluations that include clinical history, occupational history, physical examination, audiological assessment and supplementary tests when necessary.4
The audiological evaluation is conducted primarily through pure tone audiometry, logoaudiometry, and immittance testing. The latter is a test of great clinical importance, which quickly and objectively evaluates the eardrum-ossicular system and the acoustic reflex.
Immittance testing can evaluate tympanic membrane mobility and middle ear conditions, tubal function, and the stapedial reflex.
The stapedial reflex indicates that contraction of the stapedius muscle occurred, when the system is stimulated with a sudden and intense sound. The analysis of this reflex can document the presence of Metz recruitment in cochlear diseases, and of pathological adaptation in retrocochlear disorders.5,6
The acoustic reflex measurement is usually performed at 500, 1000, 2000, and 4000Hz; according to several authors, the intensity necessary to trigger the reflex in individuals with normal hearing is in the range of 70–100dB SL.7
In routine audiological testing, reflexes at 3000Hz are not usually evaluated, although there is no explanation for this omission, given the importance of this frequency in speech perception and in audiometric tests in patients exposed to loud noises. An important application of acoustic reflex measurement is in the evaluation of the cochlear phenomenon of abnormal growth of loudness (recruitment).5–8
The contralateral stapedial reflex threshold at sensitivity levels below 60dB SL can occur in ears with cochlear injury and is suggestive of recruitment. Analysis of objective Metz recruitment is conducted by measuring the sensitivity level (SL); that is, by comparing the level of the acoustic reflex threshold and the level of audiometric threshold at each frequency.5–8
The interpretation of the stapedial reflex is of great importance in clinical diagnosis. However, the literature has not yet established what its values represent in relation to hearing complaints such as hearing loss, oversensitivity to loud sounds, tinnitus, and speech perception difficulties.
This study aimed to assess contralateral stapedial reflex thresholds at 500, 1000, 2000, 3000, and 4000Hz in subjects exposed to high sound pressure levels, relating these results with the hearing complaints cited by these patients. Comparisons were made with both the absolute values of reflex thresholds and with the occurrence of Metz recruitment, measured by their respective sensitivity levels (difference between reflex and audiometric thresholds) for each frequency.
MethodsMedical records of workers exposed to high sound pressure levels were examined, and their socio-demographic data, hearing complaints, and audiometric and immittance tests were collected. Next, the relationship between hearing complaints, age, duration of noise exposure, and the results of conventional immittance tests were analyzed.
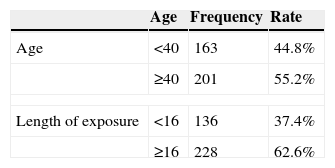
Since the decrease in hearing thresholds caused by noise exposure tends to stabilize after 15 years of exposure, we categorized the participants into two groups: <16 years of exposure to noise and ≥16 years of exposure.1
In the comparative analyses, the stapedial reflex thresholds were categorized into three groups: ≤100dB, 105–120dB, and absent reflexes. The differences between reflex and pure tone thresholds were categorized into two ranges: ≤60dB (suggestive of Metz recruitment) and >60dB (no recruitment).
A search was also performed on PubMed/MEDLINE and Scopus databases, with the MeSH terms: “Perda Auditiva Provocada por Ruído; Ruído Ocupacional; Testes Auditivos; Testes de Impedância Acústica; Detecção de Recrutamento Audiológico; Hearing Loss; Noise-Induced; Noise Occupational; Hearing Tests; Acoustic Impedance Tests; Recruitment Detection, Audiologic”, in the Portuguese and English languages, with no time limit.
Participants – inclusion and exclusion criteriaMedical records of 364 workers attended to at the Occupational Otorhinolaryngology Outpatient Clinic of a university hospital between 1998 and 2005, with ages ranging from 18 to 50 years, of both genders, pertaining to multiple professional categories and with different times of occupational noise exposure, with normal audiometric exams or with exams suggestive of hearing loss induced by noise, normal tympanograms (type A), and presence of contralateral stapedial reflexes were analyzed.
Medical records of workers with current or previous occupational exposure to chemicals, with a history of middle ear disorder, with current or previous use of ototoxic drugs, with previous acoustic, face, neck, and cervical spine trauma, and with traumatic brain injury, as well as those with diabetes, high blood pressure, kidney failure, and thyroid disorders, were excluded from the study.
ProceduresFor this analysis, the following complaints were considered: bilateral hearing loss; speech perception difficulties in adverse listening situations; oversensitivity to loud sounds, and presence of bilateral tinnitus.
The results of contralateral stapedial reflexes with immittance testing were related to hearing complaints and workers’ age and exposure times, both by their absolute values (hearing levels) and by the differences between their thresholds and pure tone audiometric thresholds (sensitivity levels). The occurrence of Metz recruitment was considered when the sensitivity level was lower than 60dB.5–8
In the comparative analysis, the thresholds of stapedial reflexes were categorized into three groups: ≤100dB, 105–120dB, and absent reflexes. The differences between reflex thresholds and pure tone audiometric thresholds were categorized into two groups: ≤60dB (suggestive of Metz recruitment) and >60dB (no recruitment).
We chose to describe the full table of analyses only for situations in which there was a statistically significant relationship in the analyzed data.
Statistical analysisThe profile of the sample was described by frequency tables for categorical variables (professional category and hearing complaints) and by descriptive statistics of continuous variables (age, noise exposure time, and stapedial reflex thresholds).
To examine the relationship between categorical variables, the chi-squared test and Fisher's exact test were used (for expected values<5). To examine the relationship between continuous variables, Spearman's correlation coefficient was used.
The significance level for statistical tests was 5% (p<0.05).
In the statistical analysis, the SAS System for Windows 8.02 (SAS Institute Inc., 1999–2001, Cary, NC, United States) was used.
Ethical aspectsThis research was approved by the Research Ethics Committee of the institution, under No. 794/2005.
ResultsMedical records of 364 workers of both genders were analyzed. 316 belonged to the metallurgical category (86.8%) and the remaining participants (13.2%) came from several other professional categories (food, oil refinery, electronics, chemistry, laundry, cosmetics, and telephony).
The ages of the workers ranged from 18 to 50 years (median 40 years, mean 39.6±7.25 years). For this analysis, the participants were categorized into two groups: <40 years and ≥40 years (Table 1).
All workers were exposed to occupational noise during at least one year, up to a maximum of 38 years (median 18 years, mean 17.3±8.1 years) (Table 1).
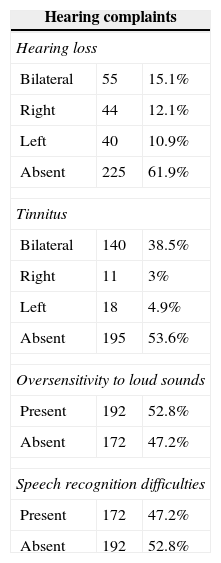
We found that only 15.1% of workers (55) had bilateral hearing loss complaints. For this analysis, complaints of unilateral hearing loss were not considered. It was also found that 38.5% of workers (140) complained of bilateral tinnitus. For this analysis, unilateral tinnitus was not considered. More than half of the workers experienced oversensitivity when hearing loud sounds (52.8%) and almost half reported speech recognition difficulties in day-to-day situations (47.2% [AG1]) (Table 2).
Distribution of workers by hearing complaints (n=364).
| Hearing complaints | ||
|---|---|---|
| Hearing loss | ||
| Bilateral | 55 | 15.1% |
| Right | 44 | 12.1% |
| Left | 40 | 10.9% |
| Absent | 225 | 61.9% |
| Tinnitus | ||
| Bilateral | 140 | 38.5% |
| Right | 11 | 3% |
| Left | 18 | 4.9% |
| Absent | 195 | 53.6% |
| Oversensitivity to loud sounds | ||
| Present | 192 | 52.8% |
| Absent | 172 | 47.2% |
| Speech recognition difficulties | ||
| Present | 172 | 47.2% |
| Absent | 192 | 52.8% |
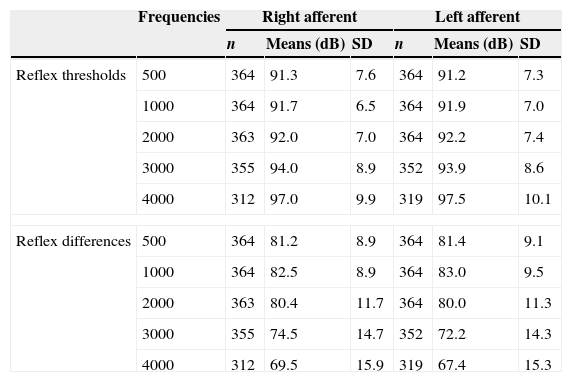
Contralateral stapedial reflex thresholds ranged from 75dB to 120dB in the right afferent and from 65dB to 120dB in the left afferent pathways. The means for contralateral stapedial reflex thresholds ranged from 91.3dB at 500Hz to 97.0dB at 4000Hz in the right afferent, and from 91.2dB at 500Hz to 97.5dB at 4000Hz in the left afferent. A tendency of increase in absolute values and variability with an increase of the frequencies’ value was observed (Table 3).
Distribution of means of contralateral stapedial reflex thresholds.
| Frequencies | Right afferent | Left afferent | |||||
|---|---|---|---|---|---|---|---|
| n | Means (dB) | SD | n | Means (dB) | SD | ||
| Reflex thresholds | 500 | 364 | 91.3 | 7.6 | 364 | 91.2 | 7.3 |
| 1000 | 364 | 91.7 | 6.5 | 364 | 91.9 | 7.0 | |
| 2000 | 363 | 92.0 | 7.0 | 364 | 92.2 | 7.4 | |
| 3000 | 355 | 94.0 | 8.9 | 352 | 93.9 | 8.6 | |
| 4000 | 312 | 97.0 | 9.9 | 319 | 97.5 | 10.1 | |
| Reflex differences | 500 | 364 | 81.2 | 8.9 | 364 | 81.4 | 9.1 |
| 1000 | 364 | 82.5 | 8.9 | 364 | 83.0 | 9.5 | |
| 2000 | 363 | 80.4 | 11.7 | 364 | 80.0 | 11.3 | |
| 3000 | 355 | 74.5 | 14.7 | 352 | 72.2 | 14.3 | |
| 4000 | 312 | 69.5 | 15.9 | 319 | 67.4 | 15.3 | |
The differences between reflex thresholds and pure tone thresholds ranged from 30 to 120dB on the right side and from 30 to 115dB on the left side. The means of differences between reflex thresholds and pure tone thresholds decreased, from 81.2dB at 500Hz to 69.5dB at 4000Hz in the right afferent; and from 81.4dB at 500Hz to 67.4dB at 4000Hz in the left afferent. A trend of a decrease in differences and of an increase in variability was observed, with an increase of frequency value (Table 3).
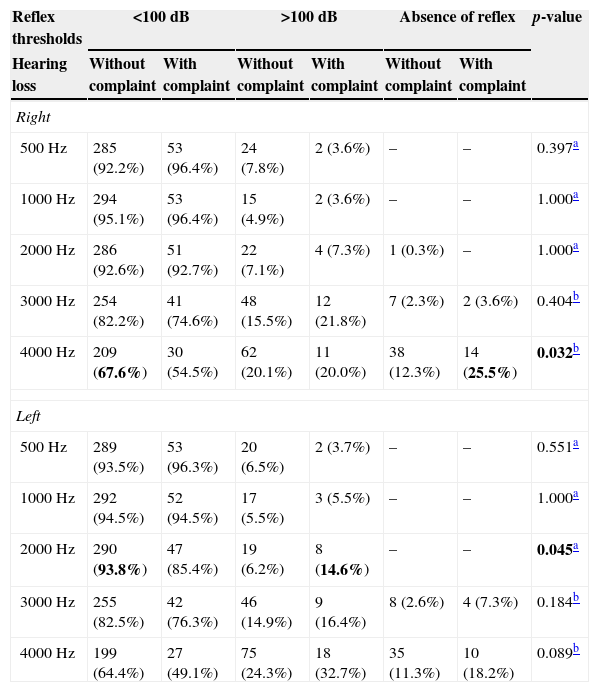
There was a significant relationship between hearing loss complaints and reflex thresholds only for the frequencies of 4000Hz in the right ear and of 2000Hz in the left ear (Table 4).
Comparison between hearing loss complaints and contralateral stapedial reflex thresholds (n=364).
| Reflex thresholds | <100dB | >100dB | Absence of reflex | p-value | |||
|---|---|---|---|---|---|---|---|
| Hearing loss | Without complaint | With complaint | Without complaint | With complaint | Without complaint | With complaint | |
| Right | |||||||
| 500Hz | 285 (92.2%) | 53 (96.4%) | 24 (7.8%) | 2 (3.6%) | – | – | 0.397a |
| 1000Hz | 294 (95.1%) | 53 (96.4%) | 15 (4.9%) | 2 (3.6%) | – | – | 1.000a |
| 2000Hz | 286 (92.6%) | 51 (92.7%) | 22 (7.1%) | 4 (7.3%) | 1 (0.3%) | – | 1.000a |
| 3000Hz | 254 (82.2%) | 41 (74.6%) | 48 (15.5%) | 12 (21.8%) | 7 (2.3%) | 2 (3.6%) | 0.404b |
| 4000Hz | 209 (67.6%) | 30 (54.5%) | 62 (20.1%) | 11 (20.0%) | 38 (12.3%) | 14 (25.5%) | 0.032b |
| Left | |||||||
| 500Hz | 289 (93.5%) | 53 (96.3%) | 20 (6.5%) | 2 (3.7%) | – | – | 0.551a |
| 1000Hz | 292 (94.5%) | 52 (94.5%) | 17 (5.5%) | 3 (5.5%) | – | – | 1.000a |
| 2000Hz | 290 (93.8%) | 47 (85.4%) | 19 (6.2%) | 8 (14.6%) | – | – | 0.045a |
| 3000Hz | 255 (82.5%) | 42 (76.3%) | 46 (14.9%) | 9 (16.4%) | 8 (2.6%) | 4 (7.3%) | 0.184b |
| 4000Hz | 199 (64.4%) | 27 (49.1%) | 75 (24.3%) | 18 (32.7%) | 35 (11.3%) | 10 (18.2%) | 0.089b |
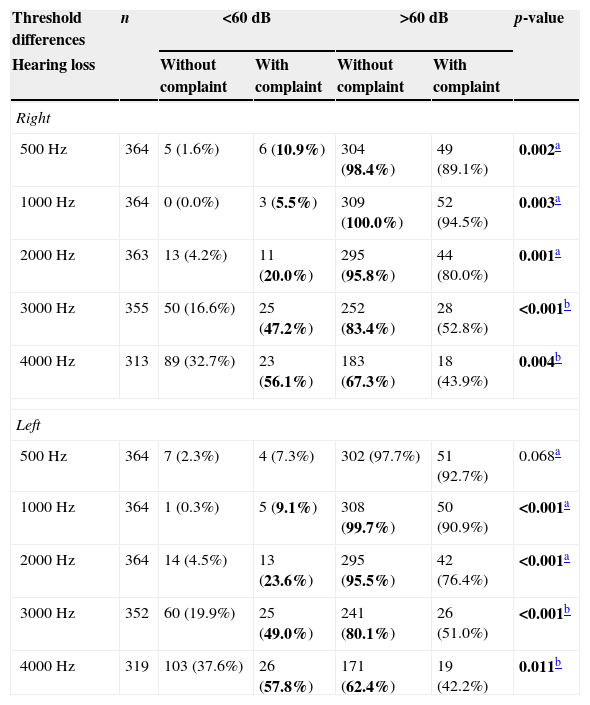
The relationship between hearing loss complaints and the presence of Metz recruitment was significant at all frequencies, except at 500Hz in the left afferent (Table 5).
Comparison between hearing loss complaints and occurrence of Metz recruitment.
| Threshold differences | n | <60dB | >60dB | p-value | ||
|---|---|---|---|---|---|---|
| Hearing loss | Without complaint | With complaint | Without complaint | With complaint | ||
| Right | ||||||
| 500Hz | 364 | 5 (1.6%) | 6 (10.9%) | 304 (98.4%) | 49 (89.1%) | 0.002a |
| 1000Hz | 364 | 0 (0.0%) | 3 (5.5%) | 309 (100.0%) | 52 (94.5%) | 0.003a |
| 2000Hz | 363 | 13 (4.2%) | 11 (20.0%) | 295 (95.8%) | 44 (80.0%) | 0.001a |
| 3000Hz | 355 | 50 (16.6%) | 25 (47.2%) | 252 (83.4%) | 28 (52.8%) | <0.001b |
| 4000Hz | 313 | 89 (32.7%) | 23 (56.1%) | 183 (67.3%) | 18 (43.9%) | 0.004b |
| Left | ||||||
| 500Hz | 364 | 7 (2.3%) | 4 (7.3%) | 302 (97.7%) | 51 (92.7%) | 0.068a |
| 1000Hz | 364 | 1 (0.3%) | 5 (9.1%) | 308 (99.7%) | 50 (90.9%) | <0.001a |
| 2000Hz | 364 | 14 (4.5%) | 13 (23.6%) | 295 (95.5%) | 42 (76.4%) | <0.001a |
| 3000Hz | 352 | 60 (19.9%) | 25 (49.0%) | 241 (80.1%) | 26 (51.0%) | <0.001b |
| 4000Hz | 319 | 103 (37.6%) | 26 (57.8%) | 171 (62.4%) | 19 (42.2%) | 0.011b |
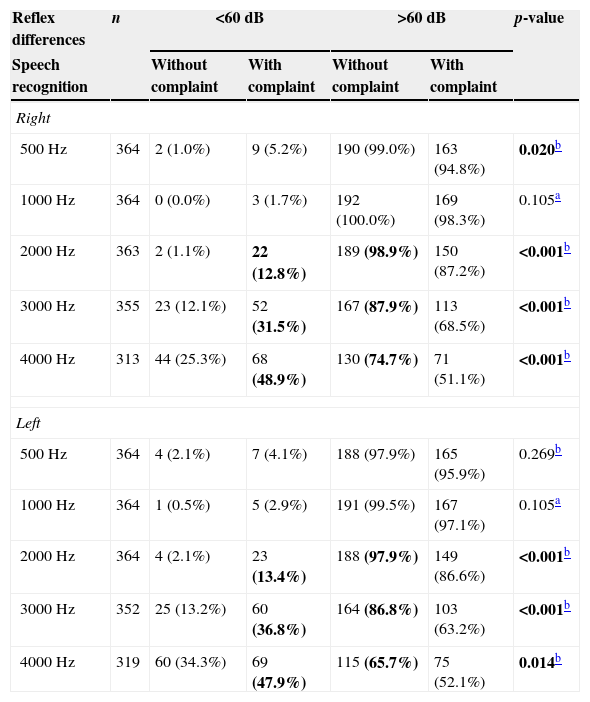
A relationship was noted between speech recognition difficulties in unfavorable listening places and the presence of Metz recruitment (Table 6).
Comparison between speech recognition and occurrence of Metz recruitment.
| Reflex differences | n | <60dB | >60dB | p-value | ||
|---|---|---|---|---|---|---|
| Speech recognition | Without complaint | With complaint | Without complaint | With complaint | ||
| Right | ||||||
| 500Hz | 364 | 2 (1.0%) | 9 (5.2%) | 190 (99.0%) | 163 (94.8%) | 0.020b |
| 1000Hz | 364 | 0 (0.0%) | 3 (1.7%) | 192 (100.0%) | 169 (98.3%) | 0.105a |
| 2000Hz | 363 | 2 (1.1%) | 22 (12.8%) | 189 (98.9%) | 150 (87.2%) | <0.001b |
| 3000Hz | 355 | 23 (12.1%) | 52 (31.5%) | 167 (87.9%) | 113 (68.5%) | <0.001b |
| 4000Hz | 313 | 44 (25.3%) | 68 (48.9%) | 130 (74.7%) | 71 (51.1%) | <0.001b |
| Left | ||||||
| 500Hz | 364 | 4 (2.1%) | 7 (4.1%) | 188 (97.9%) | 165 (95.9%) | 0.269b |
| 1000Hz | 364 | 1 (0.5%) | 5 (2.9%) | 191 (99.5%) | 167 (97.1%) | 0.105a |
| 2000Hz | 364 | 4 (2.1%) | 23 (13.4%) | 188 (97.9%) | 149 (86.6%) | <0.001b |
| 3000Hz | 352 | 25 (13.2%) | 60 (36.8%) | 164 (86.8%) | 103 (63.2%) | <0.001b |
| 4000Hz | 319 | 60 (34.3%) | 69 (47.9%) | 115 (65.7%) | 75 (52.1%) | 0.014b |
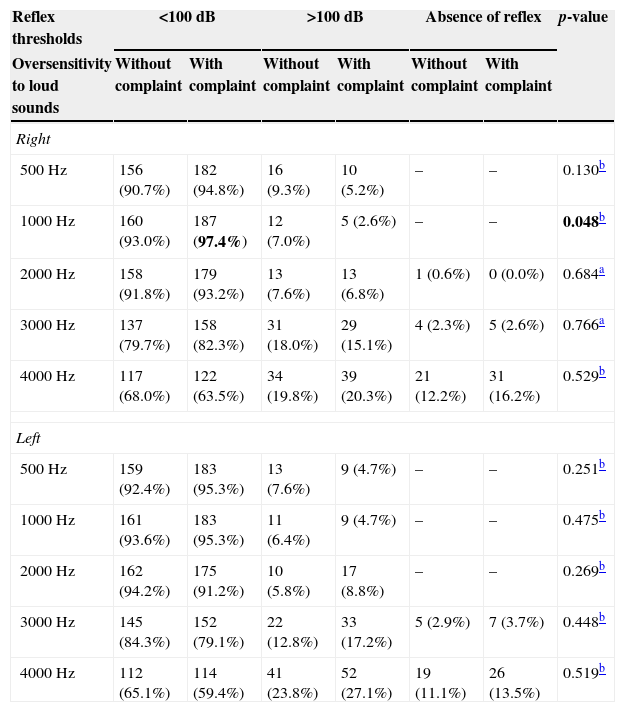
The comparison between irritation with loud sounds and the absolute values of contralateral stapedial reflex thresholds showed no significance in all presentations, except at 1000Hz in the right afferent (p=0.048) (Table 7).
Comparison between oversensitivity to loud sounds and contralateral stapedial reflex thresholds (n=364).
| Reflex thresholds | <100dB | >100dB | Absence of reflex | p-value | |||
|---|---|---|---|---|---|---|---|
| Oversensitivity to loud sounds | Without complaint | With complaint | Without complaint | With complaint | Without complaint | With complaint | |
| Right | |||||||
| 500Hz | 156 (90.7%) | 182 (94.8%) | 16 (9.3%) | 10 (5.2%) | – | – | 0.130b |
| 1000Hz | 160 (93.0%) | 187 (97.4%) | 12 (7.0%) | 5 (2.6%) | – | – | 0.048b |
| 2000Hz | 158 (91.8%) | 179 (93.2%) | 13 (7.6%) | 13 (6.8%) | 1 (0.6%) | 0 (0.0%) | 0.684a |
| 3000Hz | 137 (79.7%) | 158 (82.3%) | 31 (18.0%) | 29 (15.1%) | 4 (2.3%) | 5 (2.6%) | 0.766a |
| 4000Hz | 117 (68.0%) | 122 (63.5%) | 34 (19.8%) | 39 (20.3%) | 21 (12.2%) | 31 (16.2%) | 0.529b |
| Left | |||||||
| 500Hz | 159 (92.4%) | 183 (95.3%) | 13 (7.6%) | 9 (4.7%) | – | – | 0.251b |
| 1000Hz | 161 (93.6%) | 183 (95.3%) | 11 (6.4%) | 9 (4.7%) | – | – | 0.475b |
| 2000Hz | 162 (94.2%) | 175 (91.2%) | 10 (5.8%) | 17 (8.8%) | – | – | 0.269b |
| 3000Hz | 145 (84.3%) | 152 (79.1%) | 22 (12.8%) | 33 (17.2%) | 5 (2.9%) | 7 (3.7%) | 0.448b |
| 4000Hz | 112 (65.1%) | 114 (59.4%) | 41 (23.8%) | 52 (27.1%) | 19 (11.1%) | 26 (13.5%) | 0.519b |
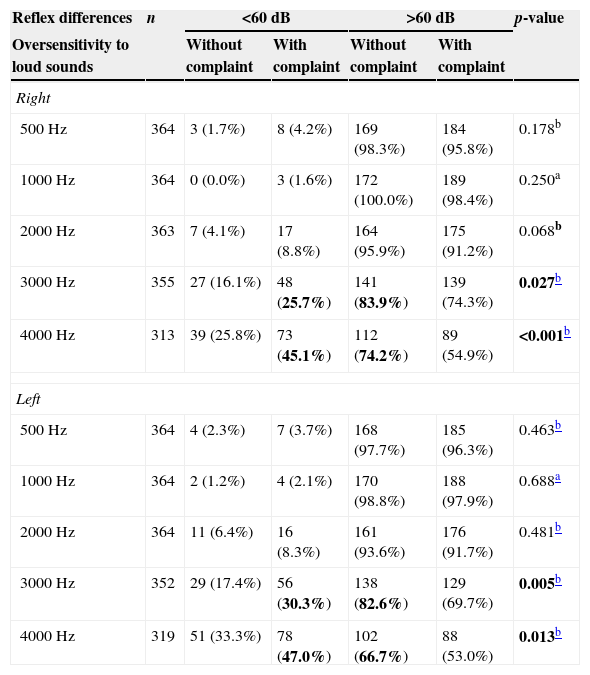
The comparison between oversensitivity to loud sounds and the occurrence of Metz recruitment showed significance, with reflexes at 3000 and 4000Hz bilaterally (Table 8).
Comparison between irritation with loud sounds and occurrence of Metz recruitment.
| Reflex differences | n | <60dB | >60dB | p-value | ||
|---|---|---|---|---|---|---|
| Oversensitivity to loud sounds | Without complaint | With complaint | Without complaint | With complaint | ||
| Right | ||||||
| 500Hz | 364 | 3 (1.7%) | 8 (4.2%) | 169 (98.3%) | 184 (95.8%) | 0.178b |
| 1000Hz | 364 | 0 (0.0%) | 3 (1.6%) | 172 (100.0%) | 189 (98.4%) | 0.250a |
| 2000Hz | 363 | 7 (4.1%) | 17 (8.8%) | 164 (95.9%) | 175 (91.2%) | 0.068b |
| 3000Hz | 355 | 27 (16.1%) | 48 (25.7%) | 141 (83.9%) | 139 (74.3%) | 0.027b |
| 4000Hz | 313 | 39 (25.8%) | 73 (45.1%) | 112 (74.2%) | 89 (54.9%) | <0.001b |
| Left | ||||||
| 500Hz | 364 | 4 (2.3%) | 7 (3.7%) | 168 (97.7%) | 185 (96.3%) | 0.463b |
| 1000Hz | 364 | 2 (1.2%) | 4 (2.1%) | 170 (98.8%) | 188 (97.9%) | 0.688a |
| 2000Hz | 364 | 11 (6.4%) | 16 (8.3%) | 161 (93.6%) | 176 (91.7%) | 0.481b |
| 3000Hz | 352 | 29 (17.4%) | 56 (30.3%) | 138 (82.6%) | 129 (69.7%) | 0.005b |
| 4000Hz | 319 | 51 (33.3%) | 78 (47.0%) | 102 (66.7%) | 88 (53.0%) | 0.013b |
The comparison between bilateral tinnitus complaints and the absolute values of contralateral stapedial reflex thresholds showed no significant relationship for all frequencies bilaterally.
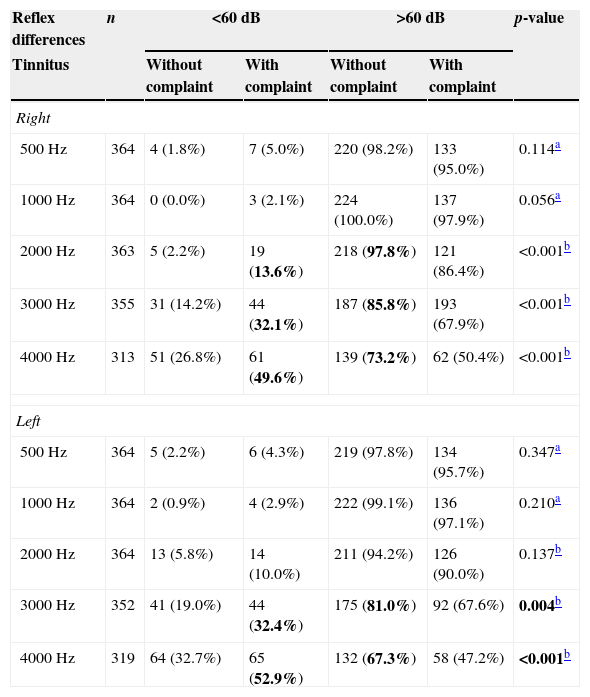
The comparison between tinnitus complaints and the presence of Metz recruitment showed a significant relationship at the frequencies of 3000 and 4000Hz bilaterally (Table 9).
Comparison between lateral tinnitus and occurrence of Metz recruitment (n=364).
| Reflex differences | n | <60dB | >60dB | p-value | ||
|---|---|---|---|---|---|---|
| Tinnitus | Without complaint | With complaint | Without complaint | With complaint | ||
| Right | ||||||
| 500Hz | 364 | 4 (1.8%) | 7 (5.0%) | 220 (98.2%) | 133 (95.0%) | 0.114a |
| 1000Hz | 364 | 0 (0.0%) | 3 (2.1%) | 224 (100.0%) | 137 (97.9%) | 0.056a |
| 2000Hz | 363 | 5 (2.2%) | 19 (13.6%) | 218 (97.8%) | 121 (86.4%) | <0.001b |
| 3000Hz | 355 | 31 (14.2%) | 44 (32.1%) | 187 (85.8%) | 193 (67.9%) | <0.001b |
| 4000Hz | 313 | 51 (26.8%) | 61 (49.6%) | 139 (73.2%) | 62 (50.4%) | <0.001b |
| Left | ||||||
| 500Hz | 364 | 5 (2.2%) | 6 (4.3%) | 219 (97.8%) | 134 (95.7%) | 0.347a |
| 1000Hz | 364 | 2 (0.9%) | 4 (2.9%) | 222 (99.1%) | 136 (97.1%) | 0.210a |
| 2000Hz | 364 | 13 (5.8%) | 14 (10.0%) | 211 (94.2%) | 126 (90.0%) | 0.137b |
| 3000Hz | 352 | 41 (19.0%) | 44 (32.4%) | 175 (81.0%) | 92 (67.6%) | 0.004b |
| 4000Hz | 319 | 64 (32.7%) | 65 (52.9%) | 132 (67.3%) | 58 (47.2%) | <0.001b |
No significant relationship was observed between age and contralateral stapedial reflex thresholds, or between age and absence of stapedial reflex.
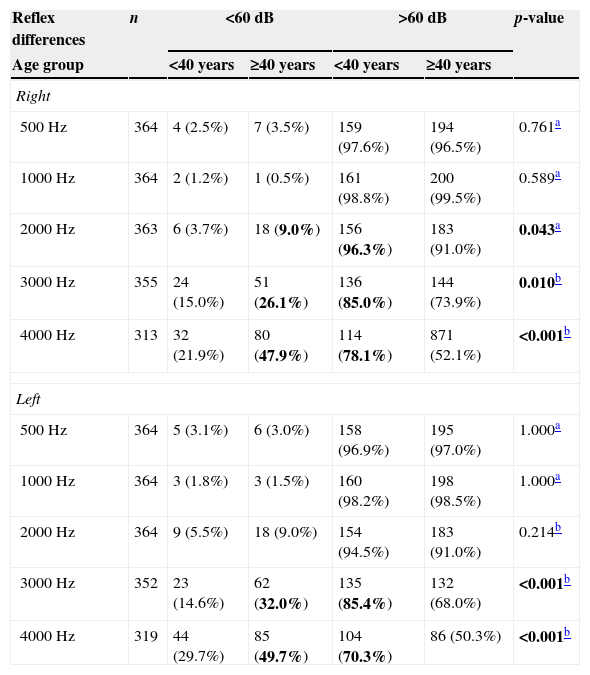
The relationship between age and the presence of Metz recruitment showed significance with reflexes at 3000 and 4000Hz bilaterally (Table 10).
Comparison between age group of workers and occurrence of Metz recruitment.
| Reflex differences | n | <60dB | >60dB | p-value | ||
|---|---|---|---|---|---|---|
| Age group | <40 years | ≥40 years | <40 years | ≥40 years | ||
| Right | ||||||
| 500Hz | 364 | 4 (2.5%) | 7 (3.5%) | 159 (97.6%) | 194 (96.5%) | 0.761a |
| 1000Hz | 364 | 2 (1.2%) | 1 (0.5%) | 161 (98.8%) | 200 (99.5%) | 0.589a |
| 2000Hz | 363 | 6 (3.7%) | 18 (9.0%) | 156 (96.3%) | 183 (91.0%) | 0.043a |
| 3000Hz | 355 | 24 (15.0%) | 51 (26.1%) | 136 (85.0%) | 144 (73.9%) | 0.010b |
| 4000Hz | 313 | 32 (21.9%) | 80 (47.9%) | 114 (78.1%) | 871 (52.1%) | <0.001b |
| Left | ||||||
| 500Hz | 364 | 5 (3.1%) | 6 (3.0%) | 158 (96.9%) | 195 (97.0%) | 1.000a |
| 1000Hz | 364 | 3 (1.8%) | 3 (1.5%) | 160 (98.2%) | 198 (98.5%) | 1.000a |
| 2000Hz | 364 | 9 (5.5%) | 18 (9.0%) | 154 (94.5%) | 183 (91.0%) | 0.214b |
| 3000Hz | 352 | 23 (14.6%) | 62 (32.0%) | 135 (85.4%) | 132 (68.0%) | <0.001b |
| 4000Hz | 319 | 44 (29.7%) | 85 (49.7%) | 104 (70.3%) | 86 (50.3%) | <0.001b |
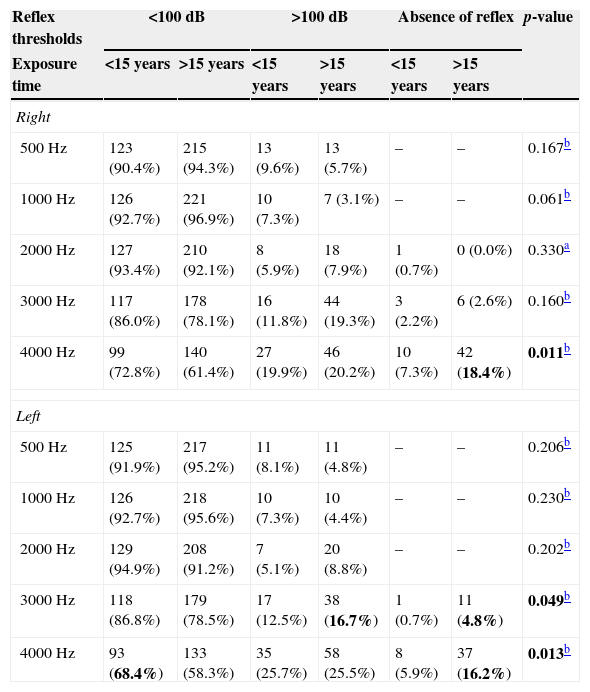
There was a significant relationship between stapedial reflexes at 4000Hz and the duration of noise exposure, bilaterally (Table 11).
Comparison between noise exposure time and contralateral stapedial reflex thresholds (n=364).
| Reflex thresholds | <100dB | >100dB | Absence of reflex | p-value | |||
|---|---|---|---|---|---|---|---|
| Exposure time | <15 years | >15 years | <15 years | >15 years | <15 years | >15 years | |
| Right | |||||||
| 500Hz | 123 (90.4%) | 215 (94.3%) | 13 (9.6%) | 13 (5.7%) | – | – | 0.167b |
| 1000Hz | 126 (92.7%) | 221 (96.9%) | 10 (7.3%) | 7 (3.1%) | – | – | 0.061b |
| 2000Hz | 127 (93.4%) | 210 (92.1%) | 8 (5.9%) | 18 (7.9%) | 1 (0.7%) | 0 (0.0%) | 0.330a |
| 3000Hz | 117 (86.0%) | 178 (78.1%) | 16 (11.8%) | 44 (19.3%) | 3 (2.2%) | 6 (2.6%) | 0.160b |
| 4000Hz | 99 (72.8%) | 140 (61.4%) | 27 (19.9%) | 46 (20.2%) | 10 (7.3%) | 42 (18.4%) | 0.011b |
| Left | |||||||
| 500Hz | 125 (91.9%) | 217 (95.2%) | 11 (8.1%) | 11 (4.8%) | – | – | 0.206b |
| 1000Hz | 126 (92.7%) | 218 (95.6%) | 10 (7.3%) | 10 (4.4%) | – | – | 0.230b |
| 2000Hz | 129 (94.9%) | 208 (91.2%) | 7 (5.1%) | 20 (8.8%) | – | – | 0.202b |
| 3000Hz | 118 (86.8%) | 179 (78.5%) | 17 (12.5%) | 38 (16.7%) | 1 (0.7%) | 11 (4.8%) | 0.049b |
| 4000Hz | 93 (68.4%) | 133 (58.3%) | 35 (25.7%) | 58 (25.5%) | 8 (5.9%) | 37 (16.2%) | 0.013b |
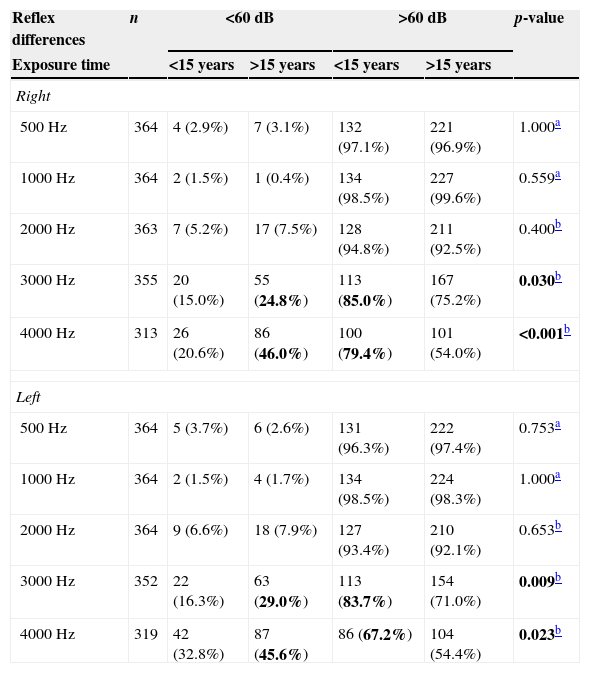
There was a significant relationship between Metz recruitment and over 15 years of exposure, as well as between absence of recruitment and 15 or fewer years of exposure at 3000 and 4000Hz, bilaterally (Table 12).
Comparison of noise exposure time of workers and occurrence of Metz recruitment.
| Reflex differences | n | <60dB | >60dB | p-value | ||
|---|---|---|---|---|---|---|
| Exposure time | <15 years | >15 years | <15 years | >15 years | ||
| Right | ||||||
| 500Hz | 364 | 4 (2.9%) | 7 (3.1%) | 132 (97.1%) | 221 (96.9%) | 1.000a |
| 1000Hz | 364 | 2 (1.5%) | 1 (0.4%) | 134 (98.5%) | 227 (99.6%) | 0.559a |
| 2000Hz | 363 | 7 (5.2%) | 17 (7.5%) | 128 (94.8%) | 211 (92.5%) | 0.400b |
| 3000Hz | 355 | 20 (15.0%) | 55 (24.8%) | 113 (85.0%) | 167 (75.2%) | 0.030b |
| 4000Hz | 313 | 26 (20.6%) | 86 (46.0%) | 100 (79.4%) | 101 (54.0%) | <0.001b |
| Left | ||||||
| 500Hz | 364 | 5 (3.7%) | 6 (2.6%) | 131 (96.3%) | 222 (97.4%) | 0.753a |
| 1000Hz | 364 | 2 (1.5%) | 4 (1.7%) | 134 (98.5%) | 224 (98.3%) | 1.000a |
| 2000Hz | 364 | 9 (6.6%) | 18 (7.9%) | 127 (93.4%) | 210 (92.1%) | 0.653b |
| 3000Hz | 352 | 22 (16.3%) | 63 (29.0%) | 113 (83.7%) | 154 (71.0%) | 0.009b |
| 4000Hz | 319 | 42 (32.8%) | 87 (45.6%) | 86 (67.2%) | 104 (54.4%) | 0.023b |
An analysis of correlations between age groups and exposure times was performed; the results were significant at all frequencies and means (Spearman's correlation coefficient, p<0.05; n=188).
DiscussionThe World Health Organization (WHO) estimates that 10% of the world population is exposed to sound pressure levels that can potentially lead to hearing loss induced by noise. The WHO considers this situation as a public health problem, and in the United States, there is evidence that NIHL is the most prevalent occupational disease.9
The review of the pertinent literature, both in searches of PubMed and Scopus, shows no similar studies comparing hearing complaints with stapedial reflex and Metz recruitment in workers with noise-induced hearing loss.10–12 Although the importance of our data is evident, it is difficult to establish a comparison of this information with the medical literature.
The comparative analysis between complaints of speech recognition difficulties and the differences between stapedial reflex and audiometric tonal thresholds showed that the presence of Metz recruitment (difference<65dB) was significant among the complainants at 2000Hz, 3000Hz, and 4000Hz bilaterally, and in the right afferent at 500Hz (Table 6). According to Costa et al., speech recognition difficulties in patients with noise-induced hearing loss are more consistent and pronounced when speech audiometry for monosyllable words is tested with masking by competitive speech.10
The relationship between hearing loss complaints and stapedial reflex thresholds was only significant for the absence of complaints and reflexes ≤100dB at 4000Hz on the right side and at 2000Hz on the left side.
A significant relationship between absence of hearing loss complaints and reflex thresholds ≤100dB only was noted at 4000Hz on the right side (p=0.032) and at 2000Hz on the left side (p=0.045).
A significant relationship between the presence of hearing loss complaints and reflex thresholds >100dB only was observed at 2000Hz on the left side, and between the presence of complaints and absence of stapedial reflex at 4000Hz on the right side (p=0.032).
In both situations, there was a slightly significant trend (p=0.045 and 0.032, respectively). In all other situations, there was no significant relationship between hearing loss complaints and contralateral stapedial reflex thresholds (Table 4).
The relationship between hearing loss complaints and the presence of Metz recruitment was significant in all presentations, except at 500Hz on the left afferent, yet with a slight trend (p=0.068) (Table 5). Metz recruitment was related also with age over 40 years and with exposure time over 16 years.
Examining the results, it can be noted that there was a significant relationship between hearing loss complaints, speech recognition difficulties, oversensitivity to loud sounds, tinnitus, age group, duration of exposure, and the occurrence of Metz recruitment at 3000 and 4000Hz bilaterally. Despite the significant relationship, no conclusions can be drawn regarding the relationship of cause and effect between these variables.
The comparison between oversensitivity to loud sounds and the absolute values for contralateral stapedial reflex thresholds showed no significance in all presentations, except at 1000Hz in the right afferent (p=0.048) (Table 7).
The comparison between sensitivity to loud sounds and the occurrence of Metz recruitment showed significance with reflexes at 3000 and 4000Hz bilaterally (Table 8).
The comparison between bilateral tinnitus complaints and the absolute values for contralateral stapedial reflex thresholds showed no significant relationship at all frequencies applied, on both sides. Also, there was no significant relationship between tinnitus complaints and absence of stapedial reflexes.
The comparison between tinnitus complaints and presence of Metz recruitment showed a significant association at frequencies of 3000 and 4000Hz bilaterally, and at 2000Hz in the right afferent (Table 9).
There was no significant relationship between the fact that the participants were under or over 40 years of age and had contralateral stapedial reflex thresholds at all frequencies and on both sides. Additionally, there was no significant relationship between the subjects’ age group and absence of stapedial reflex.
The relationship between age group and presence of Metz recruitment was significant with reflexes at 2000, 3000, and 4000Hz in the right afferent, and at 3000 and 4000Hz in the left afferent (Table 10).
There was a significant relationship between reflexes ≤100dB and subjects with 15 or fewer years of exposure at 4000Hz bilaterally. Also, there was a significant relationship between the absence of stapedial reflex and over 15 years of exposure at 4000Hz bilaterally (Table 11).
There was a significant relationship between Metz recruitment and over 15 years of exposure, as well as between absence of recruitment and 15 or fewer years of exposure at 3000 and 4000Hz bilaterally (Table 12).
Evolution has programmed humans to be aware of sounds as possible sources of danger.13 Noise can be considered as an undesirable sound that, if at high levels and after prolonged exposure, can lead to auditory and non-auditory health problems.
Hearing loss induced by noise continues to be highly prevalent in the workplace, but this condition is increasingly caused by exposure to social noises present in everyday life, e.g., the use of digital sound players.9,14
The exposure to noise, whether or not occupational, is increasingly related to auditory health problems (hearing loss, tinnitus, speech perception difficulties, and hyperacusis) and non-auditory health problems (irritation, sleep disorders, cardiovascular disease, and cognitive impairment in children).15–19
Over the past five years, several studies and advances have improved the understanding of the causes and factors of susceptibility to noise-induced hearing loss. A widely accepted hypothesis is that NIHL results from the interaction of genetic and environmental factors.20,21
The understanding of the pathophysiological mechanisms involving hair cells and auditory nerve damage has increased substantially, and several therapeutic guidelines have recently been explored. Oral medications to protect against noise-induced hearing loss are expected to become available in the coming years.9,22–24
ConclusionsThere was no significant relationship between absolute values of stapedial reflex thresholds and hearing loss complaints, oversensitivity to loud sounds, tinnitus, and age group.
The significant relationship among hearing loss complaints, speech recognition difficulties, oversensitivity to loud sounds, tinnitus, age group (over 40 years), exposure time (greater than 15 years), and the occurrence of Metz recruitment at 3000 and 4000Hz bilaterally are noteworthy. However, a cause-and-effect relationship among these variables cannot be determined.
Conflicts of interestThe authors declare no conflicts of interest.
Please cite this article as: Duarte ASM, Ng RTY, de Carvalho GM, Guimarães AC, Pinheiro LAM, da Costa EA, et al. High levels of sound pressure: acoustic reflex thresholds and auditory complaints of workers with noise exposure. Braz J Otorhinolaryngol. 2015;81:374–83.
Institution: Department of Otorhinolaryngology, Head and Neck, Medical Sciences School, Universidade Estadual de Campinas (FCM-UNICAMP), Campinas, SP, Brazil.
gology tem o prazer em homenagear os revisores


