
To verify changes in facial soft tissue using the RadiANT-DICOM-viewer and Dolphin Imaging software, through linear measurements of tomographic points in a 3D reconstruction of the face and volumetric evaluation with three-dimensional measurements of the upper airways of patients with transverse maxillary discrepancy undergoing Surgically Assisted Rapid Maxillary Expansion (SARME).
MethodsRetrospective, transverse, and descriptive study, through the analysis of computed tomography scans of the face of patients with transverse maxillary discrepancy, treated from July 2019 to December 2022. The sample consisted of 15 patients of both sexes, aged 21–42 years old, who underwent surgically assisted rapid maxillary expansion using the transpalatal distractor. Analysis was performed through linear, angular, and three-dimensional measurements in millimeters, in the preoperative and late four-month postoperative period, in frontal 3D tomographic images of the face, in the region of the width of the nose and alar base and also angular measurement in the lateral tomography for the angle nasolabial and upper airways of rhinopharynx, oropharynx and hypopharynx.
ResultsThere was an increase in nasal width with an average of 1.3467mm and an increase in the alar base with an average of 1.7333mm. A significant difference was found in the pre- and postoperative assessments of the measurements of nasal width, alar base and nasolabial angle, as well as the upper airways in all their extension. The results favour a better understanding of the professional and the patient regarding the diagnosis and management of patients with transverse maxillary width discrepancies.
ConclusionAlthough our study shows an increase in soft tissues after SARME, no aesthetic changes are observed clinically, and all patients report significant respiratory improvement. SARME may therefore contribute to the improvement of professionals working in the field of oral and maxillofacial surgery and orthodontics.
Level of evidenceLevel 4.
Maxillary atresia is considered a form of skeletal deformity characterized by a discrepancy in the maxilla/mandible relation in the transverse plane.1,2 Surgically Assisted Rapid Maxillary Expansion (SARME) is a surgical procedure for the correction of transverse maxillary deficiency.3–6 As characteristics of this deformity, patients have a posterior crossbite, which can be unilateral or bilateral, an ogival-shaped palate, loss of parabolic conformation of the dental arch (“V-shape”) and dental crowding.3,4,7 The main indication of SARME is the increase in the transverse width of the atretic maxilla, but effects are seen in the entire nasomaxillary complex, such as soft tissues and airways.1–3,6
There are several devices that can be used for maxillary expansion, such as dental anchorage devices; the Haas and Hyrax are the most used and widespread, in addition to bone anchorage distractors.6–8 Distractors such as dental anchorage devices can present numerous complications during bone expansion, such as excessive buccal torque of the teeth, periodontal defect on the buccal surface of the expanding teeth and tissue necrosis of the palate, depending on whether or not acrylic is used. On the other hand, distractors with bone anchorage eliminate these intercurrences, as well as bone expansion without buccal torque on the teeth.3,9–12
Bone and dental responses after SARME have been widely investigated.13 Although there is little evidence surrounding permanent changes in the patient’s facial profile and airway after SARME, it has been suggested that changes in hard tissue are not always followed by overlying soft tissue.9,12
Most authors have investigated the effects of soft tissue changes through teleradiographs. Direct measurements or frontal photographic analysis were proposed but proved to be limited. Lateral cephalometric radiographs and photographs provided two-dimensional (2D) data that do not allow three-dimensional (3D) analysis. In addition, direct measurements on the face are necessarily accompanied by soft tissue distortion or the identification of difficult points.6,12,13
Due to the inaccuracy of these methods to quantify soft tissue changes, the proposal of alternative techniques has increased. An example of this is 3D analysis through computed tomography scans of the face.6,13
Three-dimensional measurements proved to be more accurate than linear ones. Extraoral scanners recently introduced in the dental and orthodontic field could represent a good alternative to previous proposals to better understand the relationships between soft tissue and hard tissue before and after surgical and orthodontic treatment.6,12
The aim of this study was to evaluate the dimensional changes in the facial soft tissue, through measurements of 3D and 2D tomographic points and volumetric alterations of the upper airways, using multislice computed tomography-scans (CT-scans) of patients with transverse maxillary discrepancy submitted to SARME.
MethodsThis retrospective study was carried out by the Oral and Maxillofacial Surgery team at Ophir Loyola Hospital. Based on previous studies, the required sample to carry out this study was calculated to be 16 patients. The sample number obtained was 15 patients for soft tissue analysis, 2 of which were discarded due to having incomplete tomographic examinations; the final sample number was 13 patients, 7 women and 6 men, with a mean age of 32.2 (21–51) years old, with a power of 0.73 and 15 for airway assessment. Thirty CT-scans were used: 15 preoperative CT scans and 15 late postoperative CT scans at 4 months.
The study was approved by the Human Research Ethics Committee of the of the Ophir Loyola Hospital, Belém do Pará – CAAE: 62591822.3.0000.5550. Appraisal 5,702,295.
The patients were operated on by the same surgeon; all patients had maxillary atresia and underwent a surgical procedure in which bilateral mucoperiosteal incisions and detachment were performed, made from the piriform edges to the zygomatic buttress, as well as bilateral Le Fort I osteotomies, from the piriform borders to the pterygomaxillary junction. The sagittal osteotomy of the maxilla was performed using a delicate osteotome between the central incisors, parallel to the palate, obtaining a space of approximately 1–1.5mm. A suture was performed with resorbable material (2.0 vycril) on the alar base suture and 4.0 vycril in the buccal maxillary access region with a V–Y suture.
A transpalatal distractor (Rapid Palatal Expander, KLS Martin, KG. Germany®) was fixed in the region of the first molars using a screw on each side. The distractor was activated until separation was noticed between the central incisor teeth. Mobilization was continued until there was approximately 1.5–2mm between the central incisors. Subsequently, the device was closed and activated in the postoperative period after one week. Activation followed the manufacturer's instructions, which recommends 0.33 to 0.66mm per day (1–2 coloured markings).
Computed tomography scans were performed at two different times: before SARME (T1) and after 4 months of device use (T2).
3D images were processed from DICOM (Digital Imaging and Communications in Medicine) and constructed and aligned with the help of the software Radiant-DICOM-Viewer (64-bit; Poznan, Poland). The analysis offers the possibility to obtain multiplanes slices (sagittal, axial, and coronal) of the CT images. Preoperative and four-month late postoperative linear measurements were taken.
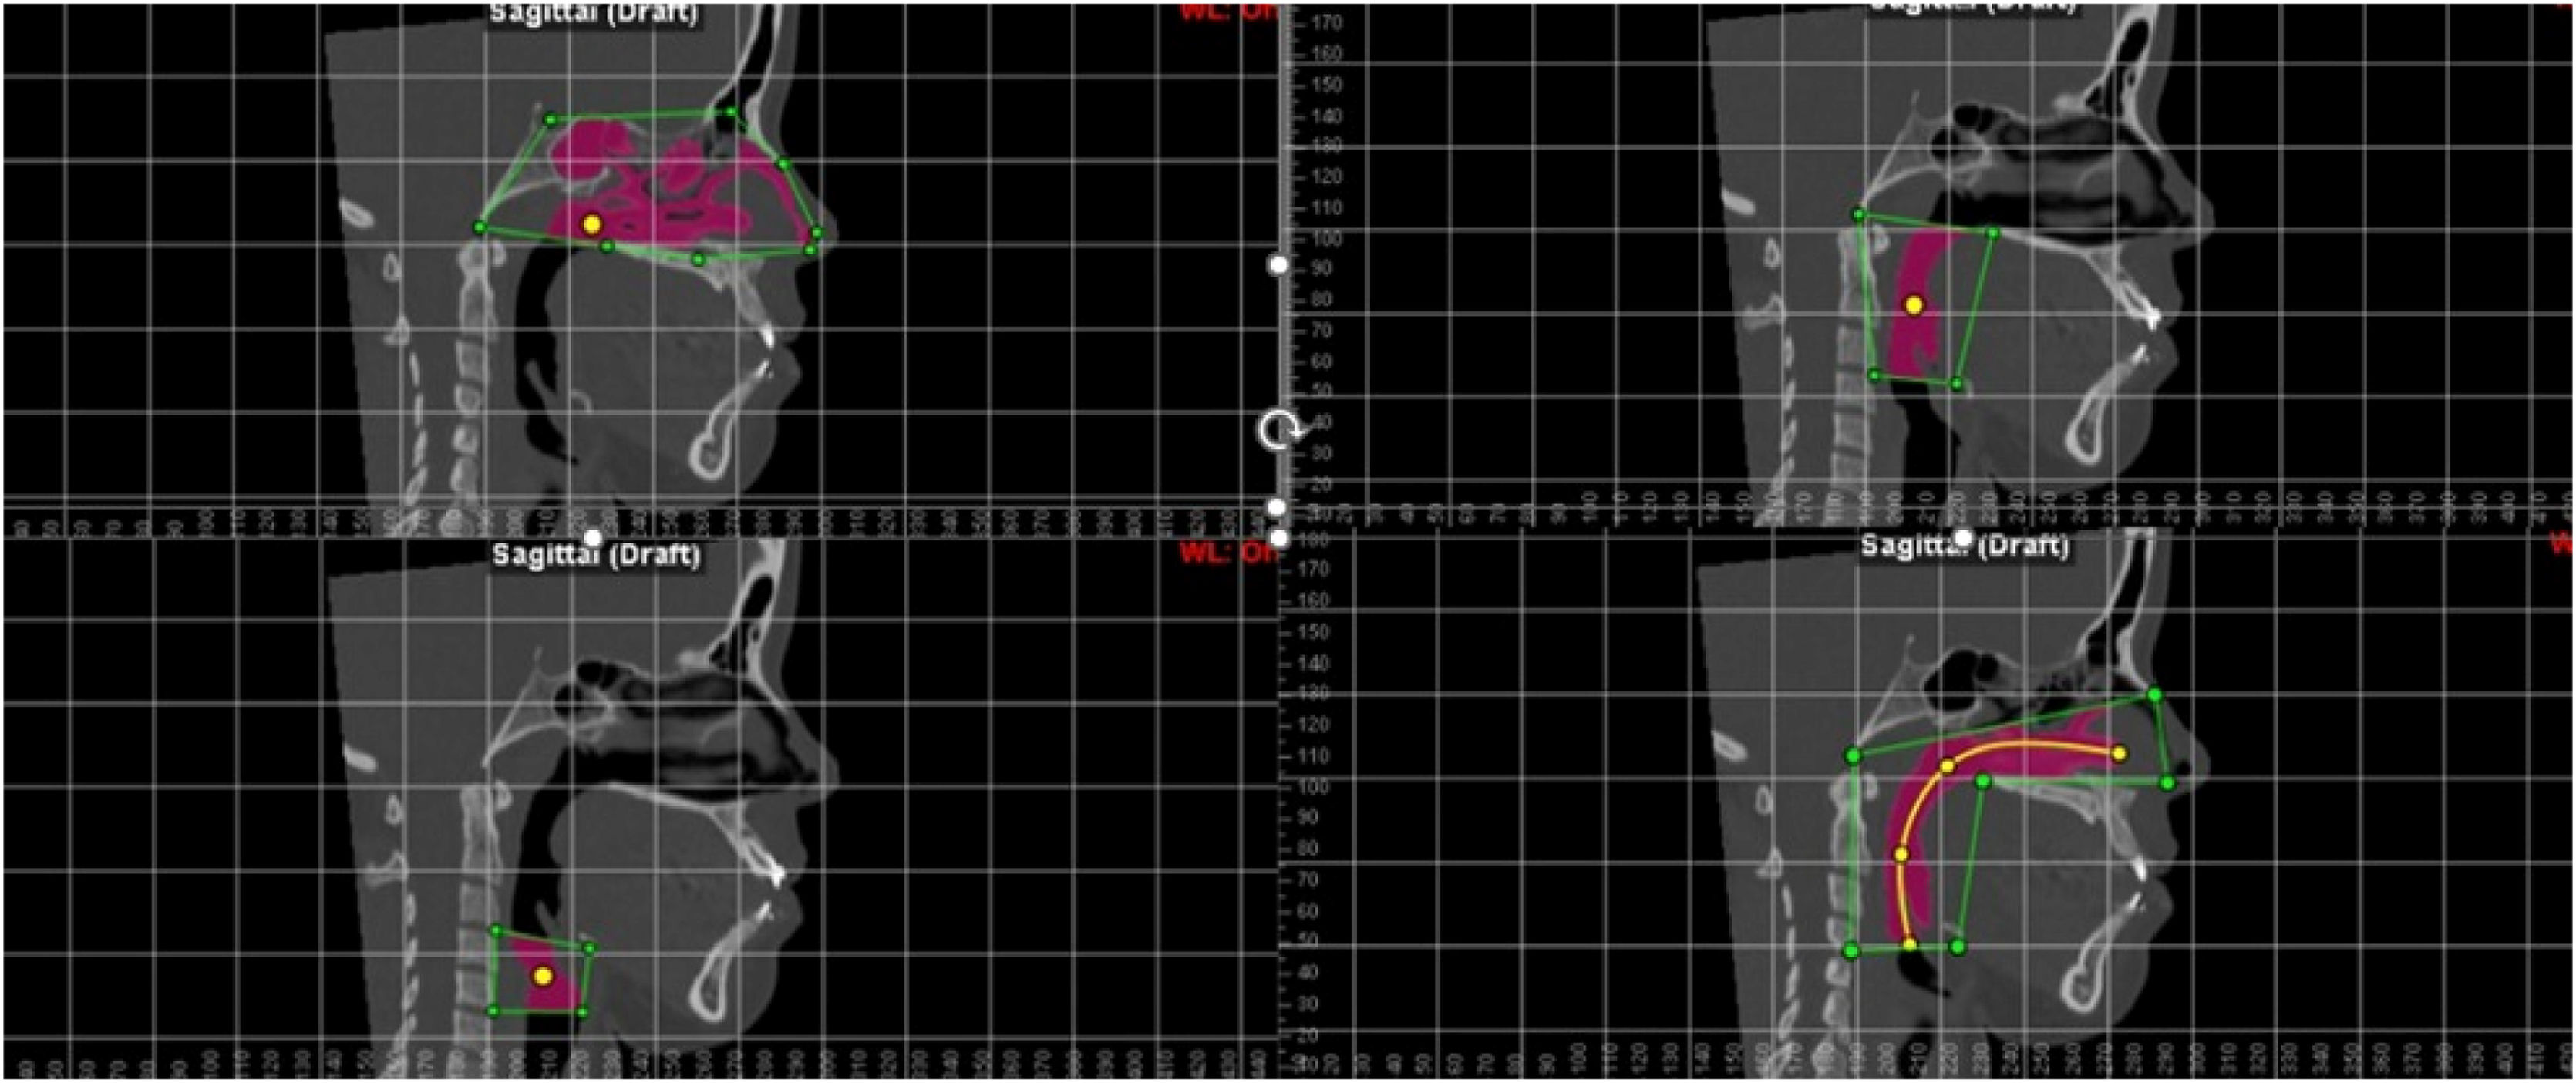
The images were oriented in the Frankfurt horizontal planes, the coronal planes of the labial commissure parallel to the lower edge of the orbit and the sagittal planes. To assess soft tissue changes, 3D cephalometric analyses were performed with specific linear points listed in Table 1. The analyses were performed by the same calibrated examiner. The width of the soft tissue of the nose was measured in 3D reconstruction at two different points: first, measuring the linear distance (mm) between points Alar (Al) AlE and AlD (nasal width) and second, measuring the distance between points Alar curvature (Ac) AcE and AcD (width of the alar base) in the pre- and postoperative period.
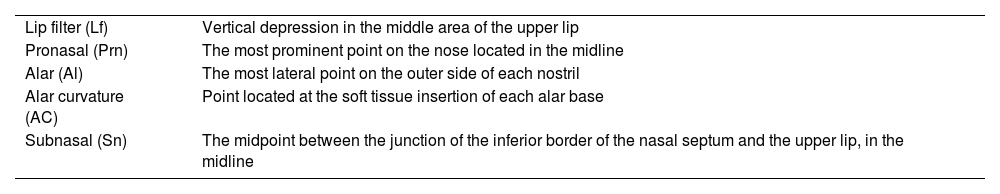
Points located in the soft tissue.
| Lip filter (Lf) | Vertical depression in the middle area of the upper lip |
| Pronasal (Prn) | The most prominent point on the nose located in the midline |
| Alar (Al) | The most lateral point on the outer side of each nostril |
| Alar curvature (AC) | Point located at the soft tissue insertion of each alar base |
| Subnasal (Sn) | The midpoint between the junction of the inferior border of the nasal septum and the upper lip, in the midline |
Angular measurements on soft tissue sagittal tomographic images were used to assess the nasolabial angle formed by the pronasal (Prn), subnasal (Sn) and philtrum points in patients pre- and postoperatively.
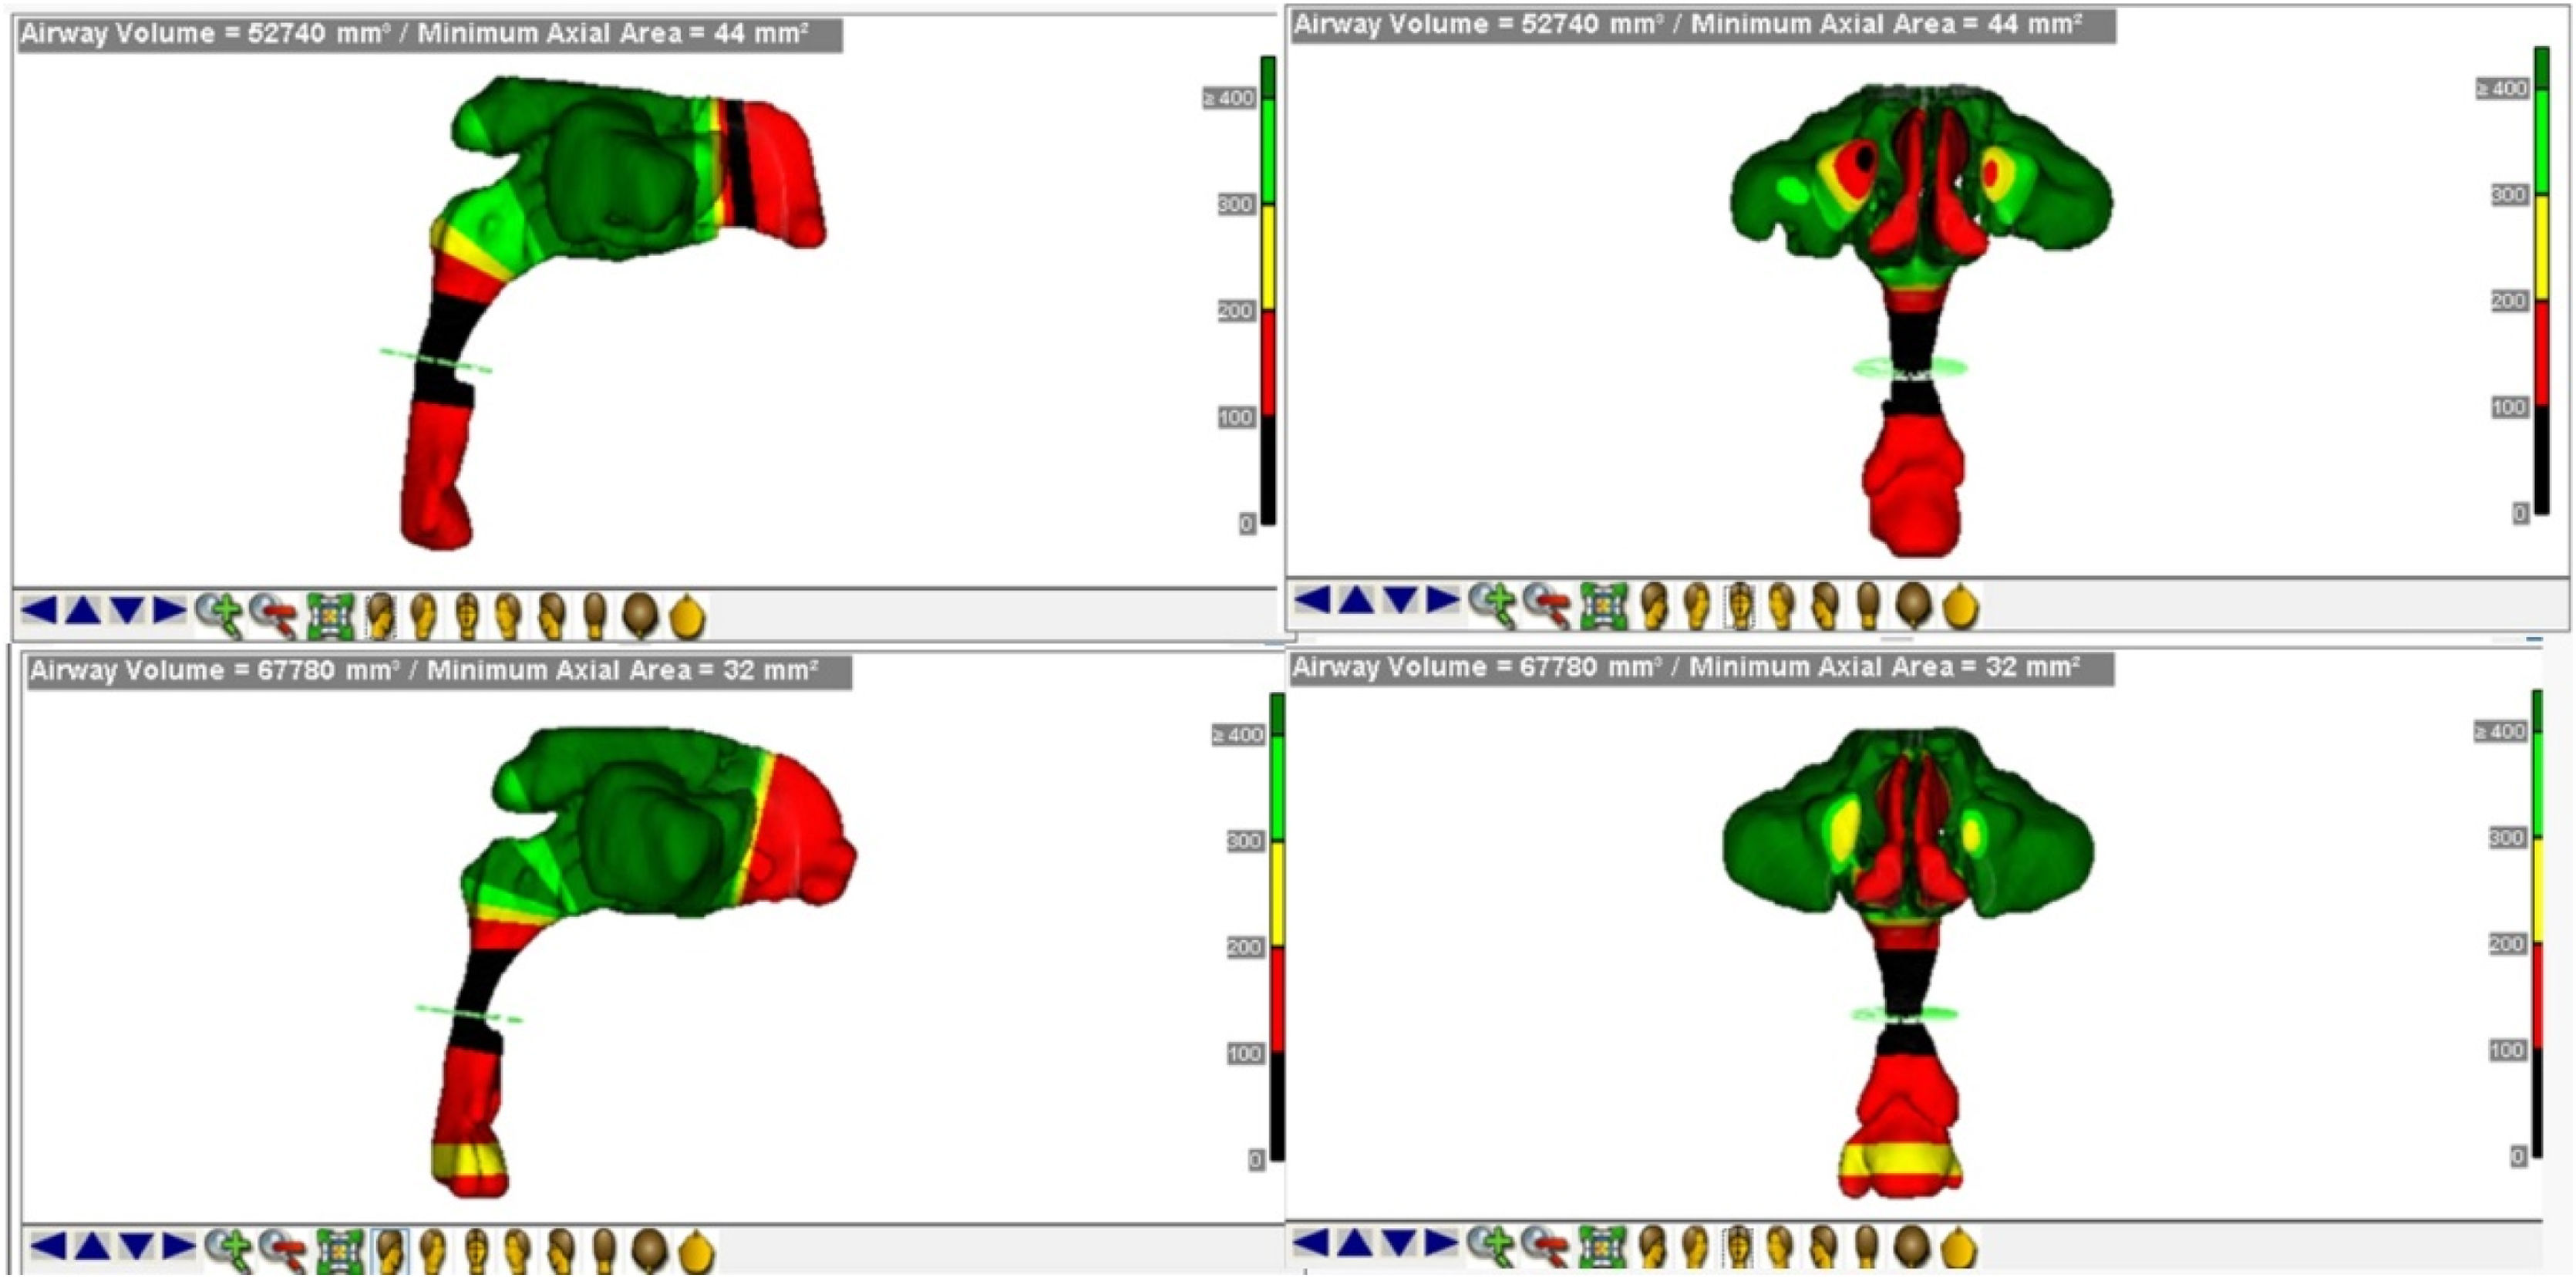
For the evaluation of the upper airways, the Dolphin Imaging software (Version 11.95.08.73 Premium, 2021 Chatsworth CA, USA) was used. The images were oriented in the Frankfurt horizontal planes, the coronal planes of the labial commissure parallel to the lower edge of the orbit and the sagittal planes. The airway segmentation process was systematized as follows: A marker for defining the intersection region, referred to in the software as “seed point”, the anatomical limits of each sub-region were established by the authors.14 Subsequently, the boundaries of the nasopharynx, oropharynx and hypopharynx were contoured within each separate region in a two-dimensional take, after which the software calculated the total airway in volume (mm3) (Fig. 1).14
Statistical analysis
Statistical analysis was performed using the Bioestat 5.3 software (Institute for Sustainable Development Mamirauá, Belém do Pará, Brazil).
Normality was checked using the Shapiro–Wilk test, using Student’s t-test to compare two quantitative and dependent normal distributions in two groups. One preoperative and one postoperative assessment was performed with the Student's t-test for normal distributions and Wilcoxon test for abnormal distributions. A p-value less than 0.05 was considered significant when testing differences between measurements taken pre- and post-SARME.
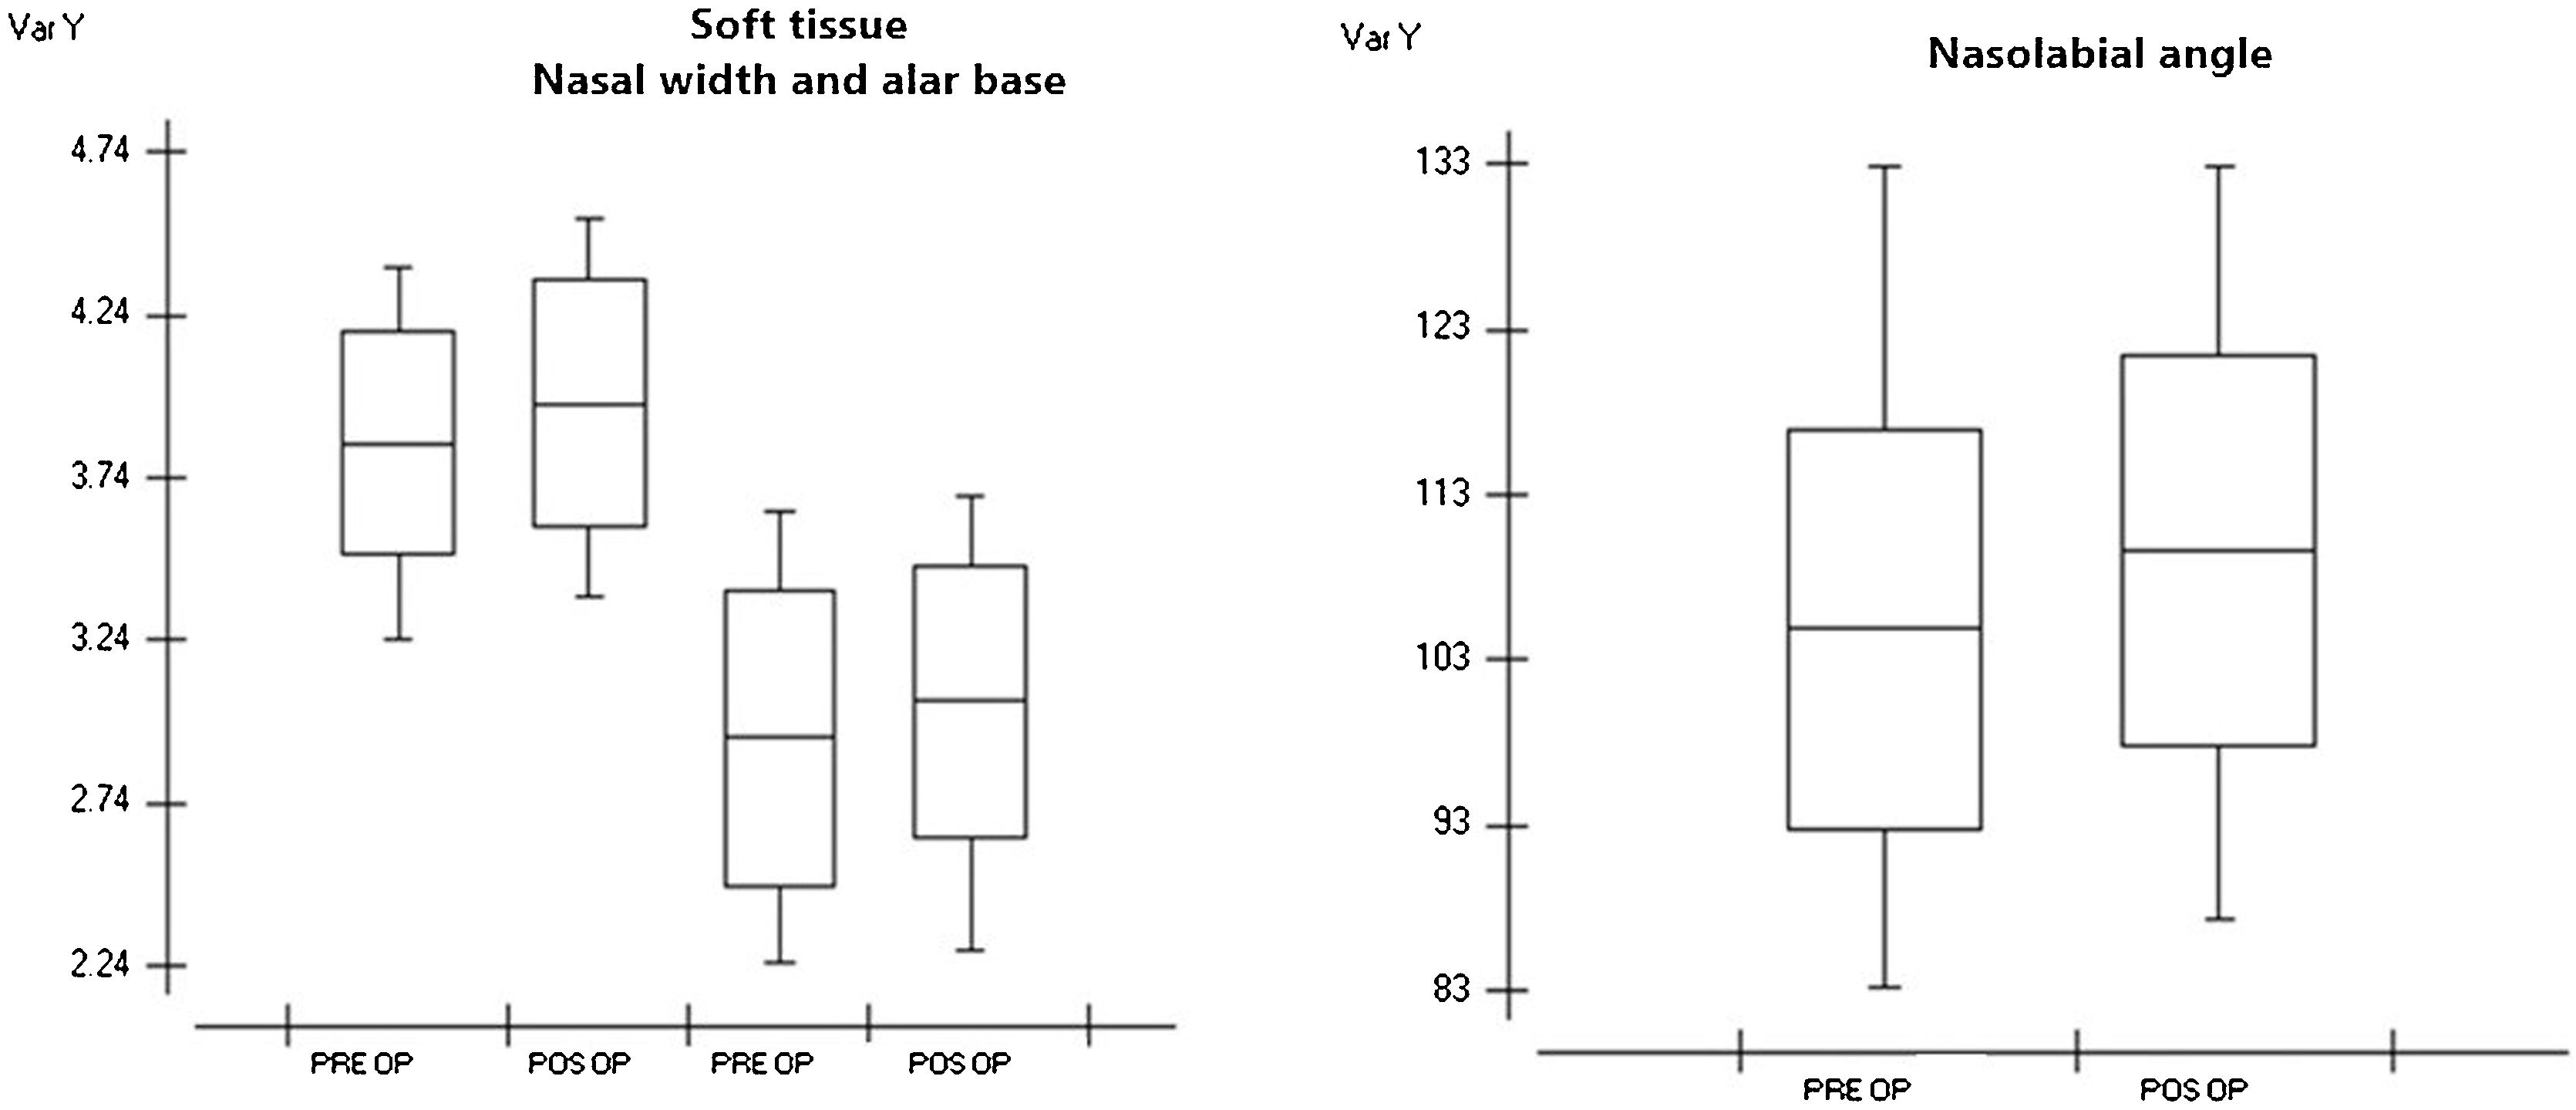
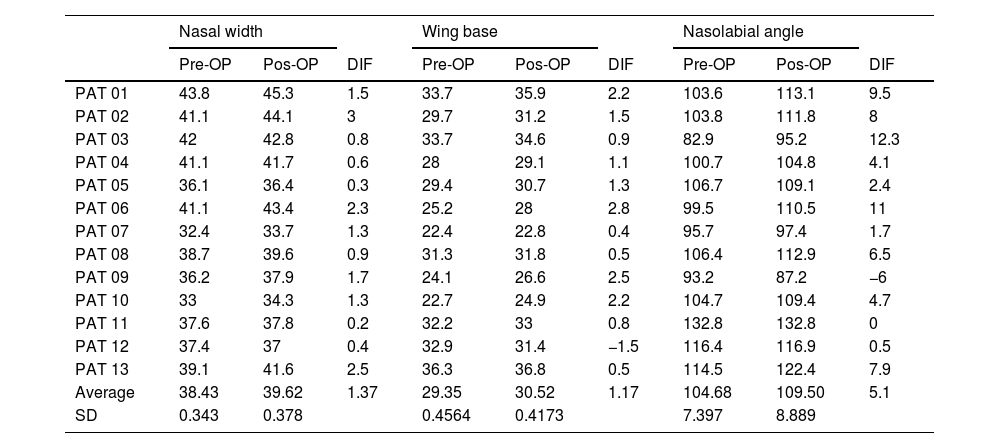
ResultsIn the measurements made in the preoperative data regarding nasal width, we obtained an average of 38.43mm with a standard deviation of 0.343mm. In the postoperative values, we obtained a mean of 39.62mm and a standard deviation of 0.378mm; the smallest difference was 0.2mm, and the largest difference was 3mm, with a mean difference of 1.37mm. We obtained a p-value of 0.0007 after statistical evaluation using Student's t-test, showing that there was a significant difference between the groups (Table 2). In the alar base measurements, we obtained a mean preoperative value of 29.3mm and a standard deviation of 0.456mm. In the postoperative values, we obtained a mean of 30.5mm and a standard deviation of 0.417mm. The smallest difference was −1.5mm and the largest difference was 2.8mm, with a mean difference of 1.54mm. A p-value of 0.0030 was obtained after statistical analysis using Student's t-test (Table 3), which showed that there was a significant difference between the groups (Fig. 2).
Facial soft tissue and nasolabial angle measurements.
| Nasal width | Wing base | Nasolabial angle | |||||||
|---|---|---|---|---|---|---|---|---|---|
| Pre-OP | Pos-OP | DIF | Pre-OP | Pos-OP | DIF | Pre-OP | Pos-OP | DIF | |
| PAT 01 | 43.8 | 45.3 | 1.5 | 33.7 | 35.9 | 2.2 | 103.6 | 113.1 | 9.5 |
| PAT 02 | 41.1 | 44.1 | 3 | 29.7 | 31.2 | 1.5 | 103.8 | 111.8 | 8 |
| PAT 03 | 42 | 42.8 | 0.8 | 33.7 | 34.6 | 0.9 | 82.9 | 95.2 | 12.3 |
| PAT 04 | 41.1 | 41.7 | 0.6 | 28 | 29.1 | 1.1 | 100.7 | 104.8 | 4.1 |
| PAT 05 | 36.1 | 36.4 | 0.3 | 29.4 | 30.7 | 1.3 | 106.7 | 109.1 | 2.4 |
| PAT 06 | 41.1 | 43.4 | 2.3 | 25.2 | 28 | 2.8 | 99.5 | 110.5 | 11 |
| PAT 07 | 32.4 | 33.7 | 1.3 | 22.4 | 22.8 | 0.4 | 95.7 | 97.4 | 1.7 |
| PAT 08 | 38.7 | 39.6 | 0.9 | 31.3 | 31.8 | 0.5 | 106.4 | 112.9 | 6.5 |
| PAT 09 | 36.2 | 37.9 | 1.7 | 24.1 | 26.6 | 2.5 | 93.2 | 87.2 | −6 |
| PAT 10 | 33 | 34.3 | 1.3 | 22.7 | 24.9 | 2.2 | 104.7 | 109.4 | 4.7 |
| PAT 11 | 37.6 | 37.8 | 0.2 | 32.2 | 33 | 0.8 | 132.8 | 132.8 | 0 |
| PAT 12 | 37.4 | 37 | 0.4 | 32.9 | 31.4 | −1.5 | 116.4 | 116.9 | 0.5 |
| PAT 13 | 39.1 | 41.6 | 2.5 | 36.3 | 36.8 | 0.5 | 114.5 | 122.4 | 7.9 |
| Average | 38.43 | 39.62 | 1.37 | 29.35 | 30.52 | 1.17 | 104.68 | 109.50 | 5.1 |
| SD | 0.343 | 0.378 | 0.4564 | 0.4173 | 7.397 | 8.889 | |||
The p-value was=0.0007 for nasal width groups and=0.0030 for alar base; the p-value was 0.0053 for the nasolabial angle group.
PAT, patient; SD, standard deviation; OP, operative; DIF, difference.
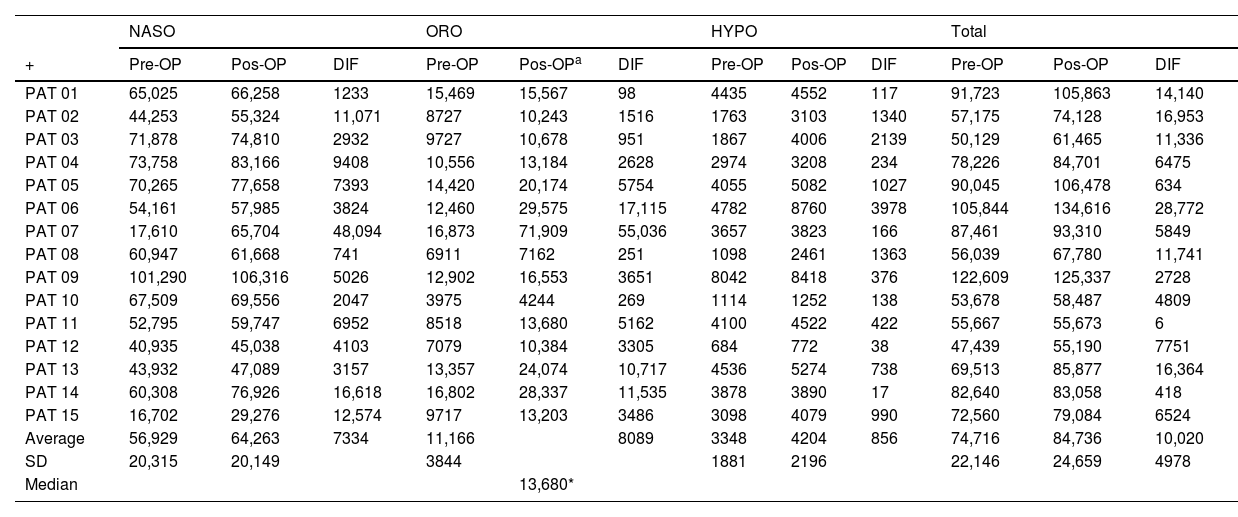
Nasopharynx, oropharynx, hypopharynx and total airway measurements.
| NASO | ORO | HYPO | Total | |||||||||
|---|---|---|---|---|---|---|---|---|---|---|---|---|
| + | Pre-OP | Pos-OP | DIF | Pre-OP | Pos-OPa | DIF | Pre-OP | Pos-OP | DIF | Pre-OP | Pos-OP | DIF |
| PAT 01 | 65,025 | 66,258 | 1233 | 15,469 | 15,567 | 98 | 4435 | 4552 | 117 | 91,723 | 105,863 | 14,140 |
| PAT 02 | 44,253 | 55,324 | 11,071 | 8727 | 10,243 | 1516 | 1763 | 3103 | 1340 | 57,175 | 74,128 | 16,953 |
| PAT 03 | 71,878 | 74,810 | 2932 | 9727 | 10,678 | 951 | 1867 | 4006 | 2139 | 50,129 | 61,465 | 11,336 |
| PAT 04 | 73,758 | 83,166 | 9408 | 10,556 | 13,184 | 2628 | 2974 | 3208 | 234 | 78,226 | 84,701 | 6475 |
| PAT 05 | 70,265 | 77,658 | 7393 | 14,420 | 20,174 | 5754 | 4055 | 5082 | 1027 | 90,045 | 106,478 | 634 |
| PAT 06 | 54,161 | 57,985 | 3824 | 12,460 | 29,575 | 17,115 | 4782 | 8760 | 3978 | 105,844 | 134,616 | 28,772 |
| PAT 07 | 17,610 | 65,704 | 48,094 | 16,873 | 71,909 | 55,036 | 3657 | 3823 | 166 | 87,461 | 93,310 | 5849 |
| PAT 08 | 60,947 | 61,668 | 741 | 6911 | 7162 | 251 | 1098 | 2461 | 1363 | 56,039 | 67,780 | 11,741 |
| PAT 09 | 101,290 | 106,316 | 5026 | 12,902 | 16,553 | 3651 | 8042 | 8418 | 376 | 122,609 | 125,337 | 2728 |
| PAT 10 | 67,509 | 69,556 | 2047 | 3975 | 4244 | 269 | 1114 | 1252 | 138 | 53,678 | 58,487 | 4809 |
| PAT 11 | 52,795 | 59,747 | 6952 | 8518 | 13,680 | 5162 | 4100 | 4522 | 422 | 55,667 | 55,673 | 6 |
| PAT 12 | 40,935 | 45,038 | 4103 | 7079 | 10,384 | 3305 | 684 | 772 | 38 | 47,439 | 55,190 | 7751 |
| PAT 13 | 43,932 | 47,089 | 3157 | 13,357 | 24,074 | 10,717 | 4536 | 5274 | 738 | 69,513 | 85,877 | 16,364 |
| PAT 14 | 60,308 | 76,926 | 16,618 | 16,802 | 28,337 | 11,535 | 3878 | 3890 | 17 | 82,640 | 83,058 | 418 |
| PAT 15 | 16,702 | 29,276 | 12,574 | 9717 | 13,203 | 3486 | 3098 | 4079 | 990 | 72,560 | 79,084 | 6524 |
| Average | 56,929 | 64,263 | 7334 | 11,166 | 8089 | 3348 | 4204 | 856 | 74,716 | 84,736 | 10,020 | |
| SD | 20,315 | 20,149 | 3844 | 1881 | 2196 | 22,146 | 24,659 | 4978 | ||||
| Median | 13,680* | |||||||||||
The p-value was=0.0451 for nasopharynx groups, =0.0401 for oropharynx, =0.0007 for hypopharynx and p<0.0001 for total airway group.
PAY, patient; SD, standard deviation; OP, operative; DIF, difference; NASO, nasopharynx; ORO, oropharynx; HYPO, hypopharynx; total, total airway.

Boxplot showing pre- and post-operative measurements of nasal width, alar base, and nasolabial angle. Graph 1 — Showing the difference between pre- and postoperative means of the nasal width preoperative means of 38.43mm and postoperative values, we obtained an average of 39.62, and Alar Base groups we obtained a mean preoperative value of 29.3mm and postoperative values we obtained an average of 30.5mm. Graph 2 — Showing pre- and post-operative angle measurements we obtained an average of 104.6° in preoperative data and in the postoperative evaluation we obtained an average of 109.5°.
Evaluating the nasolabial angle, we obtained a mean of 104.6° with a standard deviation of 12.120 in the preoperative data. In the postoperative evaluation, we obtained a mean of 109.5° with a standard deviation of 11.780; the smallest difference was −6° and the largest difference was 12.3°. We obtained a p-value of 0.0053 after statistical analysis (Table 2), demonstrating that there was a significant difference between the groups (Fig. 2).
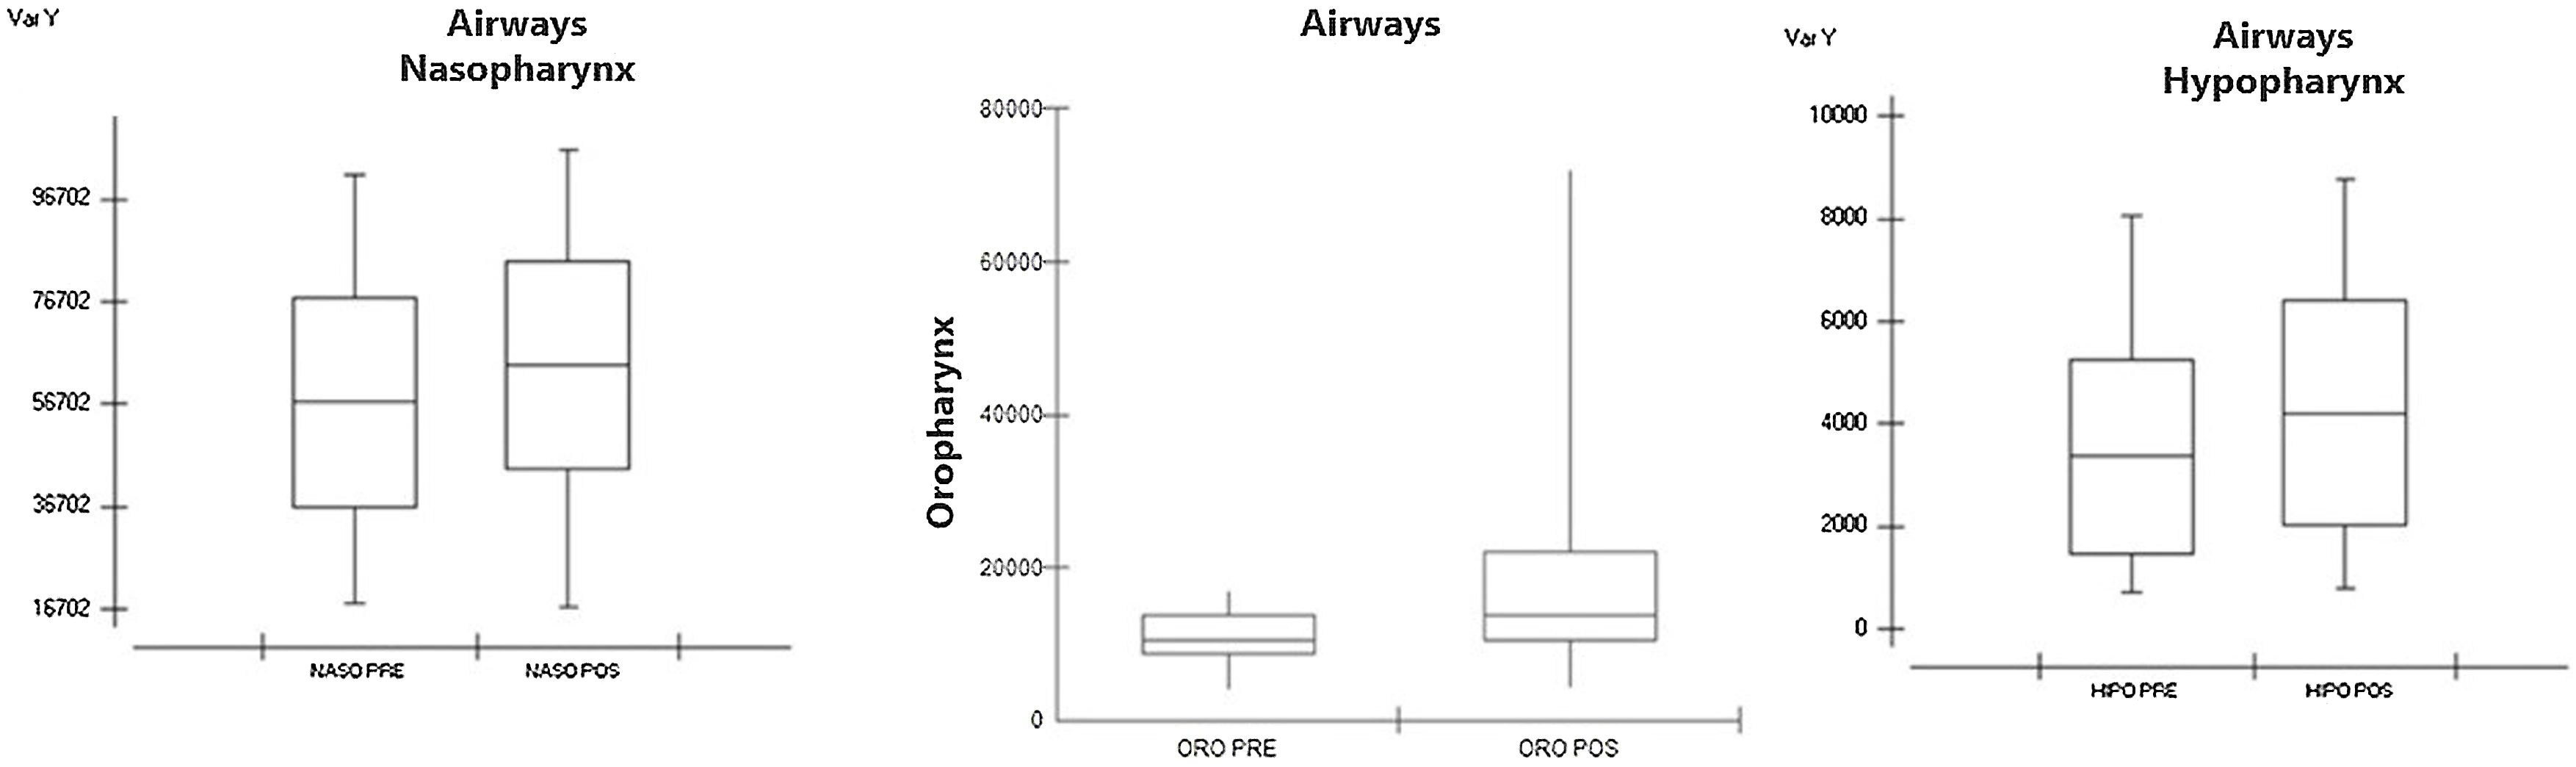
In the measurements made in the preoperative data referring to the nasopharynx, we obtained an average of 56,929mm3 with a standard deviation of 20,315mm3. In the postoperative values, we obtained a mean of 64.263mm3 and a standard deviation of 20.149mm3. The smallest difference was 741mm3 and the largest difference was 48,094mm3. We obtained a p-value of 0.0451 after statistical evaluation using Student's t-test (Table 3), which showed that there was a significant difference between the groups (Fig. 3). In the oropharynx measurements, we obtained a preoperative median of 10,556mm3 and an interquartile deviation of 5266mm3; in the postoperative values we obtained a median of 13,680mm3 and interquartile deviation of 11,593mm3, with p-value=0.0007 after statistical analysis using the Wilcoxon test (Table 3), showing that there was a significant difference between the groups (Fig. 3).

Boxplot showing pre- and post-operative measurements of nasopharynx, oropharynx, and hypopharynx. Graph 3 — In the measurements taken in the pre-operative data referring to the nasopharynx we obtained an average of 56.929mm3 and in the post-operative values we obtained an average of 64.263mm3. Graph 4 — In oropharynx measurements we obtained a preoperative median of 10,556mm3 and interquartile deviation of 5266mm3 and in postoperative values we obtained a median of 13,680mm3. Graph 5 — In the hypopharynx, we obtained an average of 3348mm3 preoperatively and an average of 4204mm3 postoperatively.
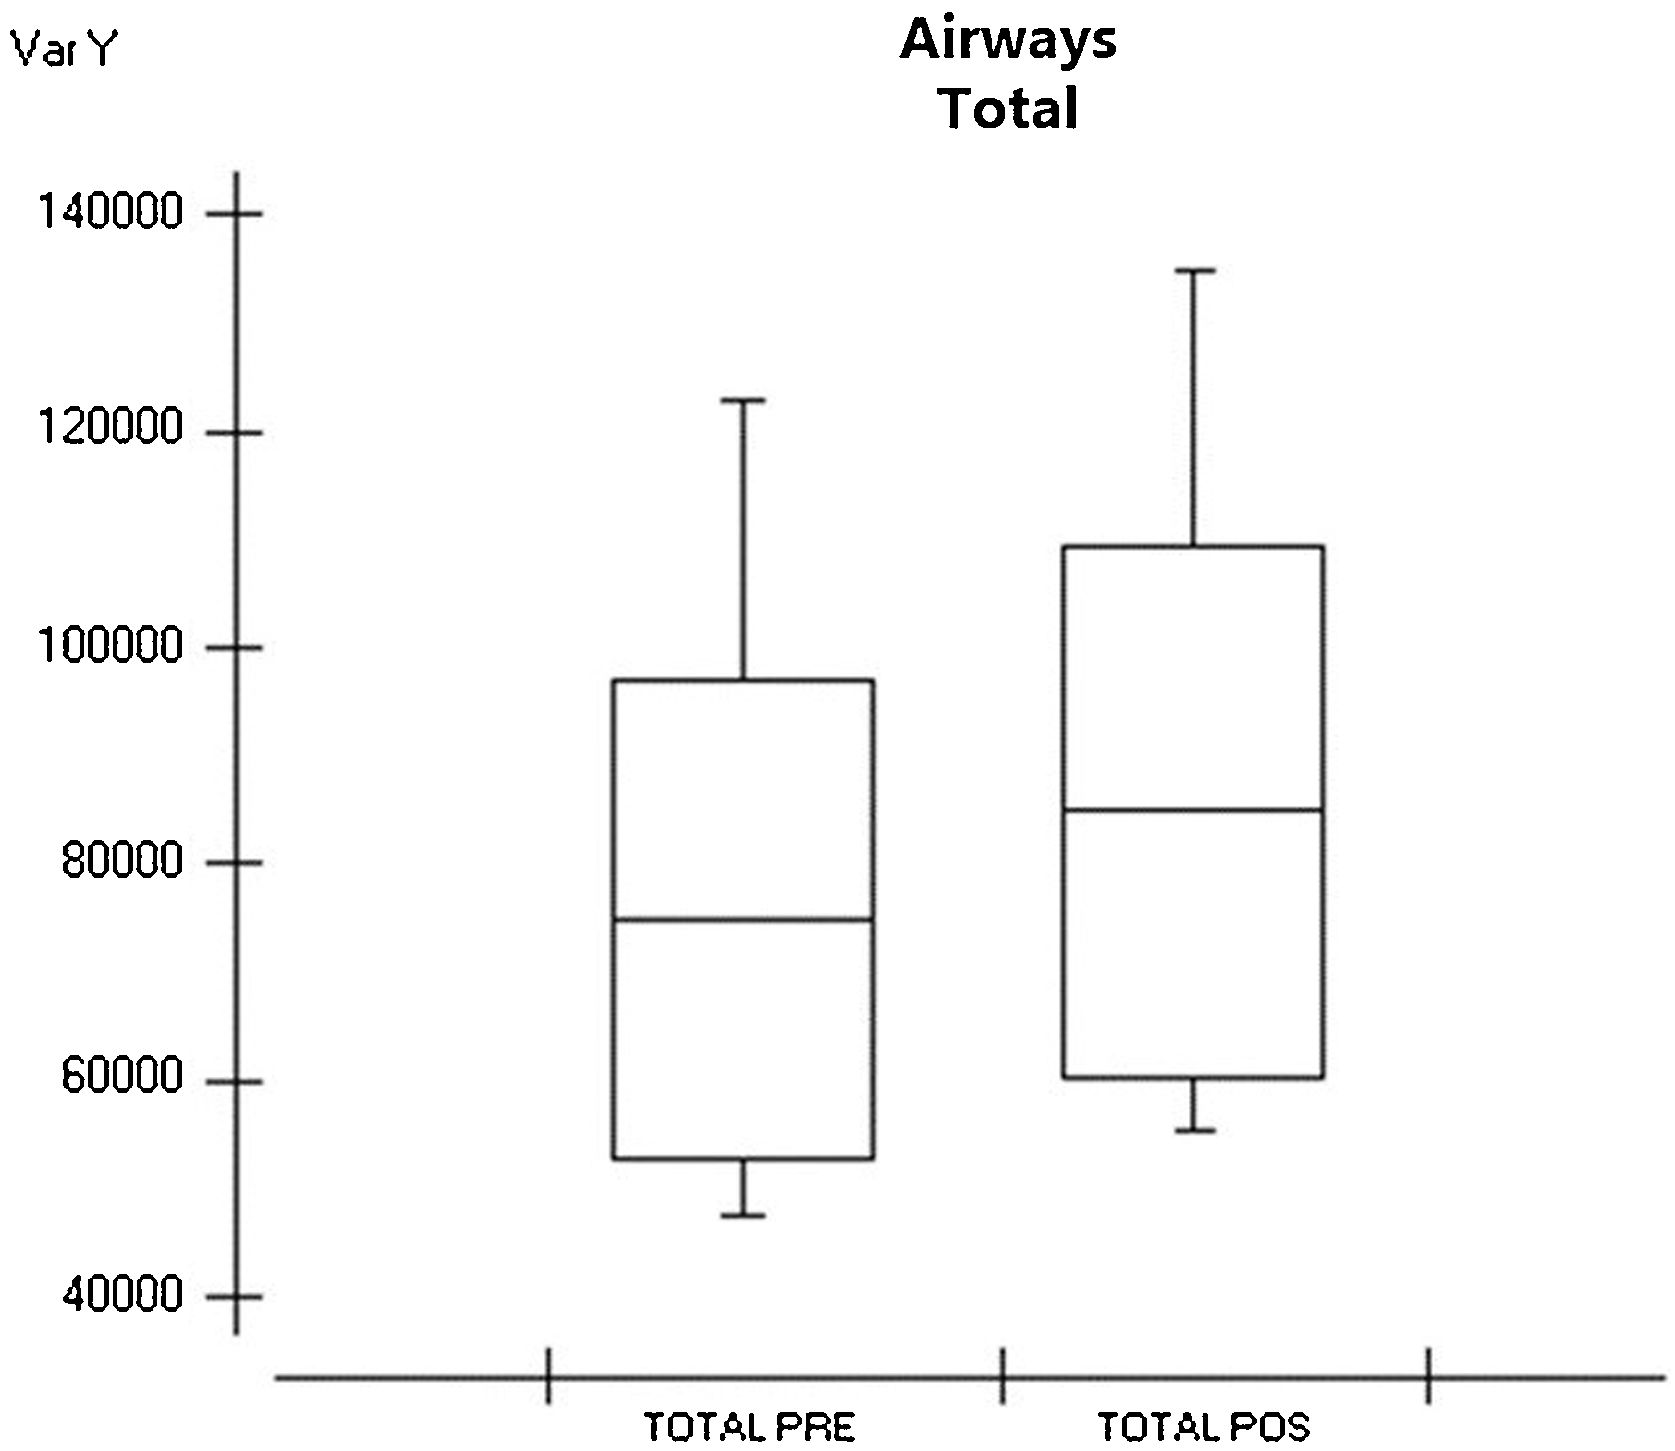
When evaluating the hypopharynx, we obtained a mean of 3348mm3 in the preoperative data with a standard deviation of 1881mm3. In the postoperative evaluation, we obtained an average of 4204mm3 with a standard deviation of 2196mm3; the smallest difference was 17mm3 and the largest difference was 3978mm3. We obtained a p-value of 0.0079 after statistical analysis (Table 3), demonstrating that there was a significant difference between the groups (Fig. 3). Evaluating the main airway, we obtained a mean of 3348mm3 with a standard deviation of 1881mm3 in the preoperative data. In the postoperative evaluation, we obtained an average of 74,716mm3 with a deviation of 22,146mm3; the smallest difference was 6mm3 and the largest difference was 77,320mm3. We calculated a p-value < 0.0001 after statistical analysis (Table 3), showing that there was a significant difference between the groups (Fig. 4) and a figure illustrating the 3D mesh of the pre- and post-operative airways of one of the patients (Fig. 5).


Patients who underwent SARME showed an increase in nasal width and an increase in the width of the alar base in the facial soft tissue as well as an increase in the nasolabial angle and in the upper airways.
DiscussionThe main purpose of the study was to evaluate possible alterations in the profile of the facial soft tissue and volumetric alterations of the upper airways in patients submitted to SARME using the transpalatal distractor.
Numerous studies have been published describing the skeletal and dentoalveolar effects of SARME; however, few have considered its effects on the soft tissues of the face or the airways, leading to a limited capacity for evidence of these changes subsequent to maxillary expansion.11,13
SARME is an effective and relatively safe technique for widening the atretic maxillae. Its effects are not limited to the maxilla but can extend to circum-maxillary structures as well as various other adjacent structures in the face and skull; in particular, it can also influence the anatomy and physiology of nasal structures. The soft tissues of the face, including the nose, have recently been investigated due to the aesthetic component and also in relation to the stability of the results obtained using expansion.15–17
The volumetric increase in the nasal cavity occurs due to the enlargement of the maxillary segments that make up the floor of the nasal cavity, which may result in an increase in air flow, consequently improving breathing.18
In our study, a significant increase was evaluated in all segments: nasal width, alar base and nasolabial angle; two patients showed divergent data in the soft tissue analysis. There was a decrease of 6° in the nasolabial angle and another 1.5mm in the alar base, possibly due to the transoperative alar base closure technique.
The first studies, which focused on changes in nasal soft tissues, were performed using measurements from digital photographs before and after SARME, directly on the faces of patients using high precision pachymeters or digital cephalometry. These studies analyzed only changes in width and length. Regarding soft tissue width, Berger et al.,15 found an average increase of 2mm after ERMCA. Our study demonstrated similar results with mean increases of 1.37mm in alar base width and 1.17mm in alar width. Both results were statistically significant.
Kim et al.8 conducted a study of 23 patients (10 men and 13 women) diagnosed with maxillary bone transverse discrepancy or arch length discrepancy, who underwent Rapid Maxillary Expansion (RME) using the rapid maxilla expander manufactured by the brand Dentaurum (Dentaurum Group, Ispringgen, Germany®). As a result of this study, a significant transverse expansion was noted in most points marked in the soft tissue, which corroborates our results.
Fastuca et al.6 carried out a randomized clinical trial with the objective of evaluating three-dimensional changes in the soft tissue of patients in the growth phase after rapid maxillary expansion. The scenario and sample population consisted of a treatment group of 17 patients and a control group of the same size. All patients in the treatment group underwent maxillary expansion surgery using a HASS-type expander. The results showed a difference between the groups in the nasal area; nasal width significantly increased by 1.98mm in the treatment group compared to the control group. The difference in the total volume of the nose was significantly increased in the treatment group compared to the control group, which was mainly related to a significant increase in the volume of the nasal dorsum.
Baysal et al.3 published a randomized clinical trial in which they evaluated changes in the alar base region of a treatment group and control group six months after RME surgery; they came to the conclusion that there was an increase of approximately 1mm.
In this study, we obtained an average difference of 1.37mm in nasal width and 1.7mm in the alar base. The increase in the nasolabial angle, with an average of 5.1°, demonstrated that there are changes in the soft tissue in the anterior region of the face. Currently, with the increasing popularity of computer-assisted surgical planning, the quantification and prediction of soft tissue changes has become an essential component of these software programs.
Postoperative CT scans, with a period longer than four months, were selected. According to Nada et al., every surgical procedure causes post-surgical oedema and, it generally takes at least four to six months to eliminate this effect.19
Nasal width, alar base width and nasolabial angle were chosen as soft tissue landmarks because they are highly reproducible and easier to understand than other soft tissue landmarks. Furthermore, it would be somewhat difficult to calibrate other soft tissue landmarks and discuss the validity of these landmarks.
One of the problems of this study was the small sample size. However, this did not influence the conclusions as the data were robust and similar to the literature (Aras et al. (11-patients); Günbay et al. 2008 (10-patients); Rubim de Assis et al. (13-patients)).2,20
The surgical procedure itself has been invasive and it has removed, even partially, the soft tissues inserted in this region, especially around of the piriform aperture. Such fact, by itself, could lead to alteration in alar base. In order to minimize possible alterations, the sutures in these structures have been performed, which seemed to positively contribute for decreasing such alterations, since this study’s data revealed a significant increase of the alar base width between the pre-operative and the 4-month postoperative periods. Nary Filho et al.,21 considered that the SAME procedures without alar base suture would lead to an invariable increase of the nasal ala. This study’s data revealed that even when the alar base suture was executed along with the V–Y suture, there was a statistically significant increase of the alar base. It has been believed that such fact would result from the enlargement of the osseous portion of the lateral wall base of the piriform aperture, where it is inserted, the soft tissues related to it.21
With the evolution of CT-scans, readily available and widely used in dentistry, we have an ideal tool to assess the upper airway, soft tissues and tissue relationships.22,23
Regarding the airways, we obtained an increase in the entire respiratory airway, nasopharynx, oropharynx, and hypopharynx. The greatest gains were obtained in the nasopharynx, with the highest average of 48,094mm3.
El et al., in a study of 70 patients evaluating pre- and postoperative CT-scans, showed that SARME creates a significant increase in the nasopharynx but with no alteration in the oropharynx region, which is in contrast to our results, as we demonstrated statistically significant differences in all of the studied variables.24 We believe that these differences in results occurred because the author performed their study with linear and angular measurements, while ours three-dimensionally assessed airway volume.
ConclusionThe results showed that there was a statistically significant increase in all segments of the upper airway, as well as an increase in changes with regard to the repercussion of the soft tissues of the face, width of the alar base, alar width and length and tissue at the height of the nose.
FundingThis research did not receive any specific grant from funding.
Conflicts of interestThe authors declare no conflicts of interest.
We thank the Ophir Loyola Hospital (Belém, Pará, Brazil) for their valuable contribution in reference monitoring for patients and support to professionals; also, to able to give conditions for this study could be performed. The whole team, our sincere thanks. We thank for all collaboration in the diagnosis, treatment, and preparation of this manuscript.
Peer Review under the responsibility of Associação Brasileira de Otorrinolaringologia e Cirurgia Cérvico-Facial.


