
Research has shown that hearing loss in musicians may cause difficulty in timbre recognition and tuning of instruments.
AimTo analyze the hearing thresholds from 250Hz to 16,000Hz in a group of music students and compare them to a non-musician group in order to determine whether high-frequency audiometry is a useful tool in the early detection of hearing impairment.
MethodsStudy design was a retrospective observational cohort. Conventional and high-frequency audiometry was performed in 42 music students (Madsen Itera II audiometer and TDH39P headphones for conventional audiometry, and HDA 200 headphones for high-frequency audiometry).
ResultsOf the 42 students, 38.1% were female students and 61.9% were male students, with a mean age of 26 years. At conventional audiometry, 92.85% had hearing thresholds within normal limits; but even within the normal limits, the worst results were observed in the left ear for all frequencies, except for 4000Hz; compared to the non-musician group, the worst results occurred at 500Hz in the left ear, and at 250Hz, 6000Hz, 9000Hz, 10,000Hz, and 11,200Hz in both the ears.
ConclusionThe periodic evaluation of high-frequency thresholds may be useful in the early detection of hearing loss in musicians.
Pesquisas comprovam que a perda auditiva em músicos pode gerar dificuldade no reconhecimento de timbres e na afinação dos instrumentos.
ObjetivoAnalisar os limiares auditivos de 250Hz a 16.000Hz de um grupo de estudantes de música e compará-los a um grupo de não músicos para determinar se a audiometria de altas frequências é um recurso útil na detecção precoce da deficiência auditiva.
MétodoForma de estudo: observacional, de coorte, retrospectivo. Realizou-se audiometria convencional e de altas frequências em 42 estudantes de música (audiômetro Madsen Itera II, fones TDH39P para a audiometria convencional e HDA 200 para audiometria de altas frequências).
ResultadosDos 42 estudantes, 38,10% eram do gênero feminino e 61,9% do gênero masculino, com média de 26 anos; na audiometria convencional 92,85% apresentaram limiares auditivos dentro dos padrões de normalidade; mesmo dentro da normalidade, piores resultados ocorreram na orelha esquerda para todas as frequências, excetuando-se 4000Hz; quando comparado ao grupo de não músicos os piores resultados ocorreram em 500Hz na orelha esquerda e 250Hz, 6000Hz, 9000Hz, 10.000Hz e 11.200Hz em ambas as orelhas.
ConclusãoA avaliação dos limiares de altas frequências de forma periódica pode ser útil na detecção precoce da deficiência auditiva em músicos.
Music has always been connected to people's life history, as a marker of both good times and bad times, and has increasingly become the focus of attention of professionals in several fields, mainly experts in hearing and acoustics. This interest is due to the fact that exposure to music is not only a social issue, but also a professional issue.
However, what is intended to be enjoyable and stimulating can damage the hearing, considering that music, as well as noise at high intensities, can cause irreversible damage to hearing.1
In a study2 performed in music schools in Germany, the sound intensity during the rehearsal of a major orchestra with a romantic music repertoire exceeded 85dB (A). If the musicians worked for eight hours a day, five days a week, noise exposure for most would exceed the upper tolerance threshold.
Another study,3 performed by the music research institute of the University of North Carolina in the United States, found that 52% of the students who participated in a woodwind instrument band, and who attended one or more rehearsals per week, were exposed to sound levels higher than 100% of the allowed dose, according to the National Institute for Occupational Safety and Health (NIOSH). At above 100% of the noise levels as defined by NIOSH, these students are exposed to very dangerous levels of sound intensity during a single rehearsal. A total of 40 students (representing brasswind, woodwind, and voice) showed a mean level of 87–95dB (A), with brasswind showing significantly higher levels.
Among the many factors that make group rehearsals a risk to hearing are the duration of exposure, the intensity of music, the acoustics of the rehearsal space, proximity to noise sources (when they are not the sound source itself, as in the case of singers), choice of repertoire, and the repetition of specific musical passages. Mostly, it is the group rehearsal that prepares students for their professional careers. Therefore, the conductors of these rehearsals are important models for the students. Methods of hearing conservation in this type of activity should be incorporated and shared between the conductors and students as a matter of professional longevity.3
The literature has many studies4–10 that present hearing loss as a result of exposure to music at high intensities, also accompanied by symptoms such as tinnitus, sensation of ear fullness, headache, and dizziness. These symptoms, along with non-auditory manifestations such as irritability and fatigue, may be the first signs of hearing damage.11
The loss of the external ciliated cells, caused by constant and systematic exposure to high sound pressure levels, can produce a reduction in cochlear amplification (motility of the external ciliated cells), resulting in loss of sensitivity to low to moderate sounds (40–60dB HL). This causes the musician to play and/or sing at increasingly higher volume, leading to higher physical effort and greater hearing loss. The loss of external ciliated cells also reduces frequency selectivity and spectral resolution of the cochlea, leading to diplacusis (abnormal perception of pitch). This condition can put the musician's career at risk for those who often make decisions about the vocal and/or instrumental tone performance. In addition, damage to the external ciliated cells leads to lack of cochlear compression or recruitment (abnormal loudness perception), which can shorten a musician's career.12
Hearing loss, regardless of the degree of auditory system involvement, can hinder the perception of tones and timbres, also hindering the tuning of the instruments, which, for musicians, can have serious consequences for their professional performance.13
Conventional pure tone audiometry (PTA) is considered the basis of audiological evaluation, representing the first test that composes the assessment. It aims to determine the individual's minimum threshold of audibility for frequencies from 250Hz to 8000Hz. This evaluation technique is the most widely used for the detection of hearing loss in individuals exposed to high sound pressure levels, either noise or music, especially at intensities >85dB (A).14,15
Although hearing disorders can be detected by conventional PTA, currently, due to the emphasis on health promotion, professionals and researchers have increasingly sought to identify these alterations as early as possible. In relation to sensorineural hearing loss, high-frequency audiometry has been used as a way to detect these alterations at an early stage, so that prevention can be performed before more significant lesions occur, according to the concept of health promotion.16
In a literature review17 on the contribution of high-frequency audiometry to the early identification of noise-induced hearing loss, the authors concluded that the hearing thresholds at high frequencies are often reduced earlier than conventional frequency thresholds, from 250Hz to 8000Hz, and therefore, they should be used in occupational hearing loss prevention programs.
The II International Congress of Medicine for Musicians, held in September 2005 in Spain, stressed that musicians are professionals with a high risk of occupational diseases, also emphasizing that there is a lack of awareness about this risk, and little demand for information that can preserve and manage the working conditions of this professional class. Although advances have occurred, preventive and health maintenance actions are still far from the ideal.18
In the field of music, music students and teachers, administrators of music schools, and conservatories have not made an effort to prevent several health risks involved in music learning and performance.19
Thus, it is imperative that preventive measures are taken, together with this professional class, to minimize the harmful effects of exposure to high sound pressure levels; this concern has led to this study, which aimed to analyze the hearing thresholds of 250–16,000Hz in a group of music students and compare them to a control group, to determine whether high-frequency audiometry can be a useful tool for early identification of hearing impairment.
Materials and methodsThis was an observational, retrospective cohort study with a quantitative approach that analyzed the auditory thresholds of 250–16,000Hz in a group of undergraduate music students, compared to a group of non-musicians and non-music students.
This research had the approval of the research ethics committee, No. 190/2011, and all individuals assessed signed an informed consent, after receiving information about the objectives, rationale, and methodology of the proposed study.
The sample consisted of 84 subjects, divided into two groups: one group (G1) consisting of 42 undergraduate music students and one group (G2) comprising 42 individuals who were non-musicians and non-music students, and who were not exposed to noise at work. Students were from three public educational institutions distributed across several areas of study (music education, popular music, instruments, music composition and conducting, sound production, and singing) and all participated in academic practice activities together.
The inclusion criterion for group G1 comprised being a music student, and the exclusion criteria included having conductive and/or sensorineural hearing disorders not associated with noise exposure, evaluated by audiometric and imitanciometry assessment.
Initially, visual inspection of the external auditory meatus was performed with a Kole otoscope to verify possible obstructions of the external auditory canal that could impair the audiological assessment. Only two students had excess wax, which was removed by an otorhinolaryngologist at the clinic where audiological evaluations were performed before the start of the examination.
The audiological evaluations were performed with a Madsen audiometer; model ITERA II with TDH 39P headphones for the conventional audiometry, and HDA 200 headphones for high-frequency audiometry and audiometric booth. All individuals were assessed according to the current standards (CFFa, 2010). The auditory rest before the audiological evaluation was 14h.
The conventional PTA assessed air-conduction hearing thresholds at frequencies from 250Hz to 8000Hz and bone conduction hearing thresholds, when the air conduction thresholds showed values >25dB HL for frequencies from 500Hz to 4000Hz.
The high-frequency tone audiometry assessed air-conduction hearing thresholds at frequencies of 9000Hz, 10,000Hz, 11,200Hz, 12,500Hz, 14,000Hz, and 16,000Hz.
Student's t-test with a significance level of 0.05 (5%) was used for the statistical analysis.
ResultsIn G1, age ranged from 18 to 58 years, with a mean of 26 years, median of 25.7 years, and standard deviation of 7.7 years. Regarding gender, 38% were female students and 62% were male students. The time of musical practice varied between one and 41 years, with a mean of 11.17 years, median of 10 years, and standard deviation of 8.42 years.
Among the 42 students, 69% played string instruments (mainly the guitar), 16.66% played woodwind and brasswind instruments, 16.66% played the piano, 14.28% played percussion, and 4.76% sang. Several students played more than one musical instrument or sang and also played an instrument. A total of 80% have played and/or sung for more than four years, and 56% have been a member of a musical group for more than four years. All students (100%) participated in academic practice activities together.
In G2, age ranged from 18 to 56 years, with a mean 25.8 years, median of 24.5 years, and standard deviation of 7.5 years. Regarding gender, 38% were female students and 62% were male students.
Of the 42 students in G1, only three had pure tone air-conduction thresholds >25dB HL in the conventional audiometry: a 20-year-old student (hearing loss at 6000Hz in the right ear), who had played the guitar for three years; a 34-year-old student (hearing loss at 8000Hz in the left ear), who had played the trombone for 20 years, and a 36-year-old student with bilateral alteration (6000Hz in the right ear and 2000–8000Hz in the left ear), who had played the guitar for one year. In all three cases, there are no reports of the use of hearing protection devices.
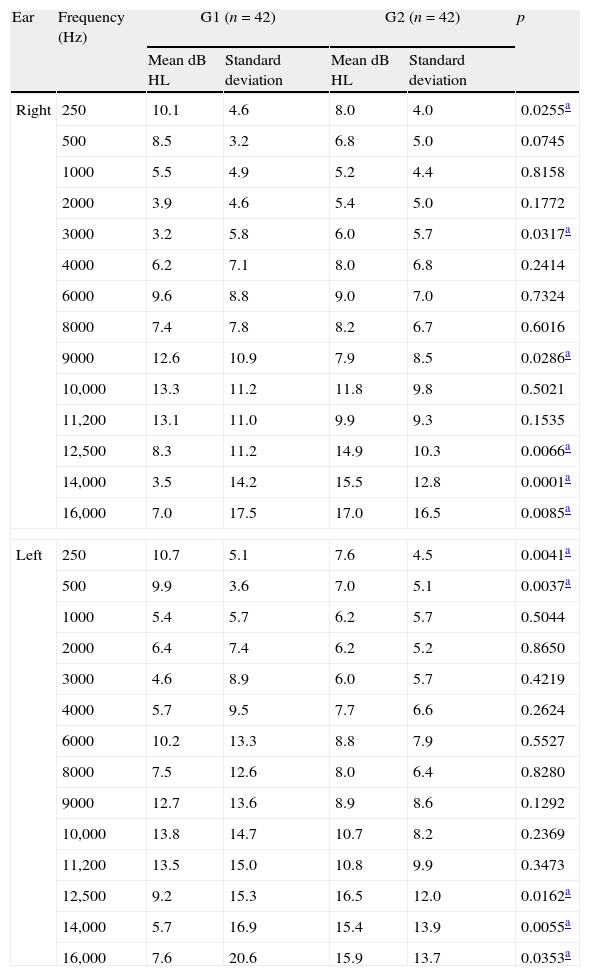
Table 1 compares the thresholds of conventional and high-frequency audiometry between G1 and G2.
Mean conventional and high frequency pure-tone air-conduction hearing thresholds in G1 and G2 (n=84).
| Ear | Frequency (Hz) | G1 (n=42) | G2 (n=42) | p | ||
| Mean dB HL | Standard deviation | Mean dB HL | Standard deviation | |||
| Right | 250 | 10.1 | 4.6 | 8.0 | 4.0 | 0.0255a |
| 500 | 8.5 | 3.2 | 6.8 | 5.0 | 0.0745 | |
| 1000 | 5.5 | 4.9 | 5.2 | 4.4 | 0.8158 | |
| 2000 | 3.9 | 4.6 | 5.4 | 5.0 | 0.1772 | |
| 3000 | 3.2 | 5.8 | 6.0 | 5.7 | 0.0317a | |
| 4000 | 6.2 | 7.1 | 8.0 | 6.8 | 0.2414 | |
| 6000 | 9.6 | 8.8 | 9.0 | 7.0 | 0.7324 | |
| 8000 | 7.4 | 7.8 | 8.2 | 6.7 | 0.6016 | |
| 9000 | 12.6 | 10.9 | 7.9 | 8.5 | 0.0286a | |
| 10,000 | 13.3 | 11.2 | 11.8 | 9.8 | 0.5021 | |
| 11,200 | 13.1 | 11.0 | 9.9 | 9.3 | 0.1535 | |
| 12,500 | 8.3 | 11.2 | 14.9 | 10.3 | 0.0066a | |
| 14,000 | 3.5 | 14.2 | 15.5 | 12.8 | 0.0001a | |
| 16,000 | 7.0 | 17.5 | 17.0 | 16.5 | 0.0085a | |
| Left | 250 | 10.7 | 5.1 | 7.6 | 4.5 | 0.0041a |
| 500 | 9.9 | 3.6 | 7.0 | 5.1 | 0.0037a | |
| 1000 | 5.4 | 5.7 | 6.2 | 5.7 | 0.5044 | |
| 2000 | 6.4 | 7.4 | 6.2 | 5.2 | 0.8650 | |
| 3000 | 4.6 | 8.9 | 6.0 | 5.7 | 0.4219 | |
| 4000 | 5.7 | 9.5 | 7.7 | 6.6 | 0.2624 | |
| 6000 | 10.2 | 13.3 | 8.8 | 7.9 | 0.5527 | |
| 8000 | 7.5 | 12.6 | 8.0 | 6.4 | 0.8280 | |
| 9000 | 12.7 | 13.6 | 8.9 | 8.6 | 0.1292 | |
| 10,000 | 13.8 | 14.7 | 10.7 | 8.2 | 0.2369 | |
| 11,200 | 13.5 | 15.0 | 10.8 | 9.9 | 0.3473 | |
| 12,500 | 9.2 | 15.3 | 16.5 | 12.0 | 0.0162a | |
| 14,000 | 5.7 | 16.9 | 15.4 | 13.9 | 0.0055a | |
| 16,000 | 7.6 | 20.6 | 15.9 | 13.7 | 0.0353a | |
It was observed that there was a significant difference between G1 and G2 at certain frequencies; in G1 the mean thresholds were worse than G2 at the frequency of 250Hz in both ears, and at 500Hz in the left ear. The study group had better mean thresholds only at 3000Hz in the right ear, when compared to the control group.
In relation to higher frequencies, there was a significant difference between G1 and G2 at 12,500Hz, 14,000Hz, and 16,000Hz in both ears, and the mean thresholds were better in the study group than the control group. Only the mean threshold of the 9000Hz frequency in the right ear was worse in the study group when compared to the control group.
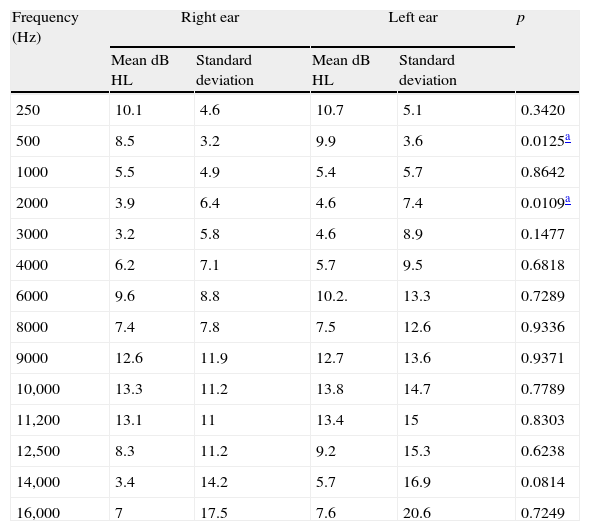
Table 2 compares the thresholds of conventional pure tone and high-frequency audiometry of G1 in the right and left ears.
Mean conventional and high frequency pure-tone air-conduction hearing thresholds of right and left ears, per frequency, in G1 (n=42).
| Frequency (Hz) | Right ear | Left ear | p | ||
| Mean dB HL | Standard deviation | Mean dB HL | Standard deviation | ||
| 250 | 10.1 | 4.6 | 10.7 | 5.1 | 0.3420 |
| 500 | 8.5 | 3.2 | 9.9 | 3.6 | 0.0125a |
| 1000 | 5.5 | 4.9 | 5.4 | 5.7 | 0.8642 |
| 2000 | 3.9 | 6.4 | 4.6 | 7.4 | 0.0109a |
| 3000 | 3.2 | 5.8 | 4.6 | 8.9 | 0.1477 |
| 4000 | 6.2 | 7.1 | 5.7 | 9.5 | 0.6818 |
| 6000 | 9.6 | 8.8 | 10.2. | 13.3 | 0.7289 |
| 8000 | 7.4 | 7.8 | 7.5 | 12.6 | 0.9336 |
| 9000 | 12.6 | 11.9 | 12.7 | 13.6 | 0.9371 |
| 10,000 | 13.3 | 11.2 | 13.8 | 14.7 | 0.7789 |
| 11,200 | 13.1 | 11 | 13.4 | 15 | 0.8303 |
| 12,500 | 8.3 | 11.2 | 9.2 | 15.3 | 0.6238 |
| 14,000 | 3.4 | 14.2 | 5.7 | 16.9 | 0.0814 |
| 16,000 | 7 | 17.5 | 7.6 | 20.6 | 0.7249 |
There was a significant difference between the mean thresholds in the right and left ears at frequencies of 500Hz and 2000Hz for the study group, with the left ear showing worse mean thresholds than the right ear.
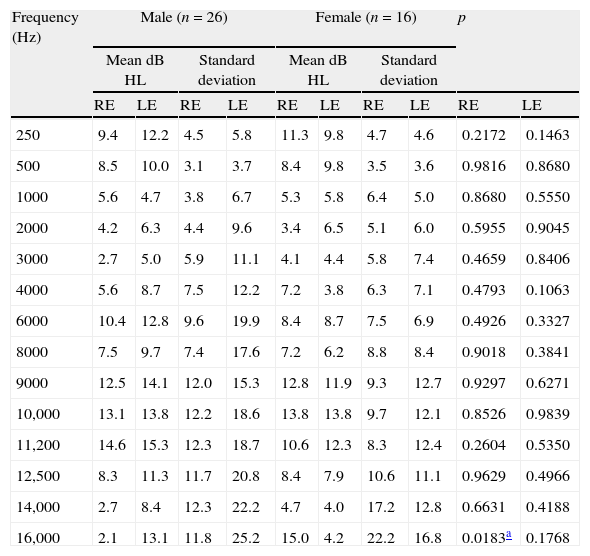
Table 3 compares the mean conventional and high frequency hearing thresholds of G1, taking into account the frequency, gender, and ear.
Mean pure-tone air-conduction hearing thresholds of right and left ears, per frequency, between male and female genders (n=42).
| Frequency (Hz) | Male (n=26) | Female (n=16) | p | |||||||
| Mean dB HL | Standard deviation | Mean dB HL | Standard deviation | |||||||
| RE | LE | RE | LE | RE | LE | RE | LE | RE | LE | |
| 250 | 9.4 | 12.2 | 4.5 | 5.8 | 11.3 | 9.8 | 4.7 | 4.6 | 0.2172 | 0.1463 |
| 500 | 8.5 | 10.0 | 3.1 | 3.7 | 8.4 | 9.8 | 3.5 | 3.6 | 0.9816 | 0.8680 |
| 1000 | 5.6 | 4.7 | 3.8 | 6.7 | 5.3 | 5.8 | 6.4 | 5.0 | 0.8680 | 0.5550 |
| 2000 | 4.2 | 6.3 | 4.4 | 9.6 | 3.4 | 6.5 | 5.1 | 6.0 | 0.5955 | 0.9045 |
| 3000 | 2.7 | 5.0 | 5.9 | 11.1 | 4.1 | 4.4 | 5.8 | 7.4 | 0.4659 | 0.8406 |
| 4000 | 5.6 | 8.7 | 7.5 | 12.2 | 7.2 | 3.8 | 6.3 | 7.1 | 0.4793 | 0.1063 |
| 6000 | 10.4 | 12.8 | 9.6 | 19.9 | 8.4 | 8.7 | 7.5 | 6.9 | 0.4926 | 0.3327 |
| 8000 | 7.5 | 9.7 | 7.4 | 17.6 | 7.2 | 6.2 | 8.8 | 8.4 | 0.9018 | 0.3841 |
| 9000 | 12.5 | 14.1 | 12.0 | 15.3 | 12.8 | 11.9 | 9.3 | 12.7 | 0.9297 | 0.6271 |
| 10,000 | 13.1 | 13.8 | 12.2 | 18.6 | 13.8 | 13.8 | 9.7 | 12.1 | 0.8526 | 0.9839 |
| 11,200 | 14.6 | 15.3 | 12.3 | 18.7 | 10.6 | 12.3 | 8.3 | 12.4 | 0.2604 | 0.5350 |
| 12,500 | 8.3 | 11.3 | 11.7 | 20.8 | 8.4 | 7.9 | 10.6 | 11.1 | 0.9629 | 0.4966 |
| 14,000 | 2.7 | 8.4 | 12.3 | 22.2 | 4.7 | 4.0 | 17.2 | 12.8 | 0.6631 | 0.4188 |
| 16,000 | 2.1 | 13.1 | 11.8 | 25.2 | 15.0 | 4.2 | 22.2 | 16.8 | 0.0183a | 0.1768 |
RE, right ear; LE, left ear.
There was a significant difference between the mean thresholds of male and female genders only for the right ear at 16,000Hz, with female students showing worse means than the male students.
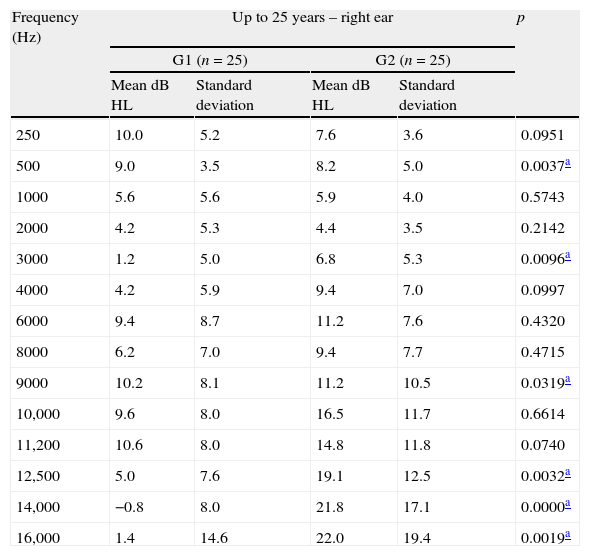
Table 4 compares the mean conventional pure tone air-conduction and high-frequency hearing thresholds in the right ear between G1 and G2 for the age range up to 25 years.
Mean right ear hearing thresholds, per frequency, for age up to 25 years (n=50).
| Frequency (Hz) | Up to 25 years – right ear | p | |||
| G1 (n=25) | G2 (n=25) | ||||
| Mean dB HL | Standard deviation | Mean dB HL | Standard deviation | ||
| 250 | 10.0 | 5.2 | 7.6 | 3.6 | 0.0951 |
| 500 | 9.0 | 3.5 | 8.2 | 5.0 | 0.0037a |
| 1000 | 5.6 | 5.6 | 5.9 | 4.0 | 0.5743 |
| 2000 | 4.2 | 5.3 | 4.4 | 3.5 | 0.2142 |
| 3000 | 1.2 | 5.0 | 6.8 | 5.3 | 0.0096a |
| 4000 | 4.2 | 5.9 | 9.4 | 7.0 | 0.0997 |
| 6000 | 9.4 | 8.7 | 11.2 | 7.6 | 0.4320 |
| 8000 | 6.2 | 7.0 | 9.4 | 7.7 | 0.4715 |
| 9000 | 10.2 | 8.1 | 11.2 | 10.5 | 0.0319a |
| 10,000 | 9.6 | 8.0 | 16.5 | 11.7 | 0.6614 |
| 11,200 | 10.6 | 8.0 | 14.8 | 11.8 | 0.0740 |
| 12,500 | 5.0 | 7.6 | 19.1 | 12.5 | 0.0032a |
| 14,000 | −0.8 | 8.0 | 21.8 | 17.1 | 0.0000a |
| 16,000 | 1.4 | 14.6 | 22.0 | 19.4 | 0.0019a |
There is a significant difference for G1 between the mean pure tone air-conduction hearing thresholds in students aged up to 25 years and G2 at 500, 3000, 9000, 12,500, 14,000 and 16,000Hz, with the best results reported by G1, except at the frequency of 500Hz, where better results were observed in G2.
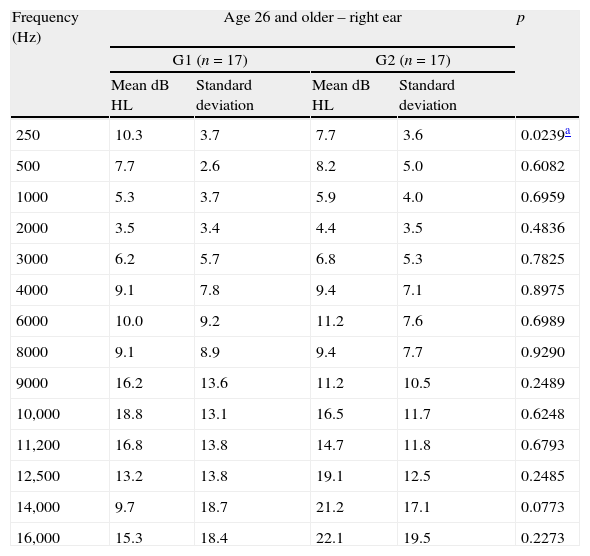
Table 5 compares conventional pure-tone and high frequency air-conduction hearing thresholds in the left ear between G1 and G2 in those aged 26 years and older.
Mean pure-tone air-conduction right ear thresholds, by frequency, for age range 26 and older, in groups G1 and G2 (n=34).
| Frequency (Hz) | Age 26 and older – right ear | p | |||
| G1 (n=17) | G2 (n=17) | ||||
| Mean dB HL | Standard deviation | Mean dB HL | Standard deviation | ||
| 250 | 10.3 | 3.7 | 7.7 | 3.6 | 0.0239a |
| 500 | 7.7 | 2.6 | 8.2 | 5.0 | 0.6082 |
| 1000 | 5.3 | 3.7 | 5.9 | 4.0 | 0.6959 |
| 2000 | 3.5 | 3.4 | 4.4 | 3.5 | 0.4836 |
| 3000 | 6.2 | 5.7 | 6.8 | 5.3 | 0.7825 |
| 4000 | 9.1 | 7.8 | 9.4 | 7.1 | 0.8975 |
| 6000 | 10.0 | 9.2 | 11.2 | 7.6 | 0.6989 |
| 8000 | 9.1 | 8.9 | 9.4 | 7.7 | 0.9290 |
| 9000 | 16.2 | 13.6 | 11.2 | 10.5 | 0.2489 |
| 10,000 | 18.8 | 13.1 | 16.5 | 11.7 | 0.6248 |
| 11,200 | 16.8 | 13.8 | 14.7 | 11.8 | 0.6793 |
| 12,500 | 13.2 | 13.8 | 19.1 | 12.5 | 0.2485 |
| 14,000 | 9.7 | 18.7 | 21.2 | 17.1 | 0.0773 |
| 16,000 | 15.3 | 18.4 | 22.1 | 19.5 | 0.2273 |
There was a significant difference for G1 between mean pure tone air-conduction hearing thresholds in students aged 26 years and older and G2 only at the frequency of 250Hz, with the best results reported by G2.
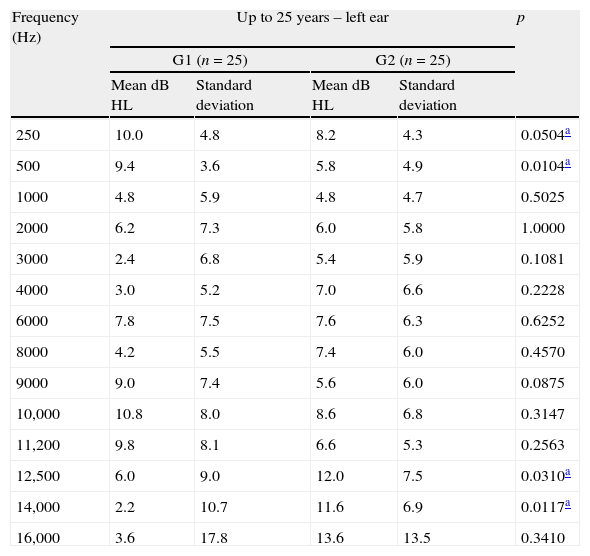
Table 6 compares the mean conventional pure-tone and high frequency air-conduction hearing thresholds in the left ear between G1 and G2 in students aged up to 25 years.
Mean pure-tone air-conduction thresholds in the left ear, by frequency, for age up to 25 years in groups G1 and G2 (n=50).
| Frequency (Hz) | Up to 25 years – left ear | p | |||
| G1 (n=25) | G2 (n=25) | ||||
| Mean dB HL | Standard deviation | Mean dB HL | Standard deviation | ||
| 250 | 10.0 | 4.8 | 8.2 | 4.3 | 0.0504a |
| 500 | 9.4 | 3.6 | 5.8 | 4.9 | 0.0104a |
| 1000 | 4.8 | 5.9 | 4.8 | 4.7 | 0.5025 |
| 2000 | 6.2 | 7.3 | 6.0 | 5.8 | 1.0000 |
| 3000 | 2.4 | 6.8 | 5.4 | 5.9 | 0.1081 |
| 4000 | 3.0 | 5.2 | 7.0 | 6.6 | 0.2228 |
| 6000 | 7.8 | 7.5 | 7.6 | 6.3 | 0.6252 |
| 8000 | 4.2 | 5.5 | 7.4 | 6.0 | 0.4570 |
| 9000 | 9.0 | 7.4 | 5.6 | 6.0 | 0.0875 |
| 10,000 | 10.8 | 8.0 | 8.6 | 6.8 | 0.3147 |
| 11,200 | 9.8 | 8.1 | 6.6 | 5.3 | 0.2563 |
| 12,500 | 6.0 | 9.0 | 12.0 | 7.5 | 0.0310a |
| 14,000 | 2.2 | 10.7 | 11.6 | 6.9 | 0.0117a |
| 16,000 | 3.6 | 17.8 | 13.6 | 13.5 | 0.3410 |
There was a significant difference for G1 between the mean pure tone air-conduction hearing thresholds in students aged up to 25 years and G2 at frequencies of 250 and 500Hz, where G1 has worse results when compared to G2. As for the frequencies of 12,500 and 14,000Hz, the best results were shown by G1.
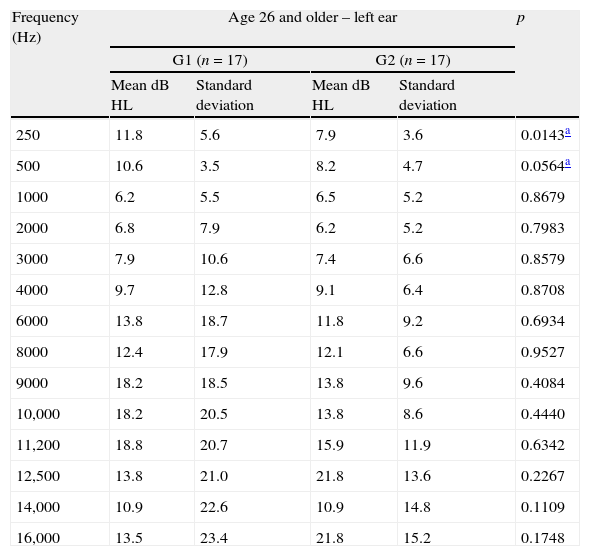
Finally, Table 7 compares the mean conventional pure-tone air-conduction and high frequency hearing thresholds in the left ear between the two groups in students aged 26 years and older.
Mean pure-tone air-conduction thresholds in the left ear, by frequency, for age range 26 and older, in groups G1 and G2 (n=34).
| Frequency (Hz) | Age 26 and older – left ear | p | |||
| G1 (n=17) | G2 (n=17) | ||||
| Mean dB HL | Standard deviation | Mean dB HL | Standard deviation | ||
| 250 | 11.8 | 5.6 | 7.9 | 3.6 | 0.0143a |
| 500 | 10.6 | 3.5 | 8.2 | 4.7 | 0.0564a |
| 1000 | 6.2 | 5.5 | 6.5 | 5.2 | 0.8679 |
| 2000 | 6.8 | 7.9 | 6.2 | 5.2 | 0.7983 |
| 3000 | 7.9 | 10.6 | 7.4 | 6.6 | 0.8579 |
| 4000 | 9.7 | 12.8 | 9.1 | 6.4 | 0.8708 |
| 6000 | 13.8 | 18.7 | 11.8 | 9.2 | 0.6934 |
| 8000 | 12.4 | 17.9 | 12.1 | 6.6 | 0.9527 |
| 9000 | 18.2 | 18.5 | 13.8 | 9.6 | 0.4084 |
| 10,000 | 18.2 | 20.5 | 13.8 | 8.6 | 0.4440 |
| 11,200 | 18.8 | 20.7 | 15.9 | 11.9 | 0.6342 |
| 12,500 | 13.8 | 21.0 | 21.8 | 13.6 | 0.2267 |
| 14,000 | 10.9 | 22.6 | 10.9 | 14.8 | 0.1109 |
| 16,000 | 13.5 | 23.4 | 21.8 | 15.2 | 0.1748 |
There was a significant difference for G1 between the mean pure-tone air-conduction hearing thresholds in students aged 26 years and older and G2 only at frequencies of 250 and 500Hz, with the best results reported by G2.
DiscussionHearing loss induced by high levels of sound pressure occurs by systemic and prolonged exposure to loud sounds (>85dB (A)/8h/day). With an insidious onset, its main features are chronicity and irreversibility, as it affects the ciliated cells of the organ of Corti.20–23 In addition, according to the National Committee on Noise and Hearing Conservation, not only the time of exposure and sound intensity, but also individual susceptibility is considered as a factor for hearing loss onset.
According to NR7, Annex I (1998), hearing loss induced by high levels of sound pressure is considered as changes in hearing thresholds resulting from systematic occupational exposure to intense sound. Its main features, irreversibility and gradual progression with time of exposure to risk, initially affect the frequencies of 3000Hz, 4000Hz or 6000Hz, followed by 8000Hz and 500Hz, and finally 250Hz.
In comparison with conventional audiometry, a significant difference was observed between G1 and G2 at frequencies of 250Hz in both ears and 500Hz in the left ear. Although there was no significant difference for the frequency of 6000Hz, the mean pure tone air-conduction thresholds found in G1, at that frequency in both ears, were worse than the thresholds shown by G2.
These findings are in agreement with a study24 conducted with 329 music students, in which there was an audiogram notch at the frequency of 6000Hz in 78% of the audiometries performed.
Another study25 observed that 20% of the music students had music-induced hearing loss (MIHL), and in Brazil, one study16 demonstrated that 38.46% of the music students had an audiogram suggestive of MIHL, followed by 46.15% showing a normal audiogram with notch at 3000, 4000, or 6000Hz.
A study4 performed with young musicians, aged 18–37 years, found 7% with normal audiogram and presence of notch, and 24% of the audiograms suggested MIHL.
A study26 conducted with 23 rock musicians, aged 21–38 years, with the majority (57%) in the age range between 21 and 26 years, demonstrated that, although 100% of the ears had auditory thresholds within normal limits, the distribution of hearing thresholds showed a large concentration of worse thresholds at 3000, 4000 and 6000Hz, exactly those that are first affected in the process that triggers MIHL.
Regarding professional musicians, the literature is vast regarding the results that are characterized as MIHL. For instance, there are three studies performed with orchestra musicians: the first study27 shows 52.5% of musicians with MIHL; the second study,28 shows 21.7%; and the third study29 shows 19%. Concerning hearing loss in rock and jazz bands, one study30 reported 52.39% of musicians with MIHL, and regarding instrumental bands, one study31 observed 13% of musicians with MIHL; another study8 demonstrated 52.4% with MIHL, and a third study6 showed 24% with hearing disorders suggestive of MIHL.
Regarding the lower frequencies, the literature showed no findings that either corroborated or contested those found in this study. As all participating groups (G1 and G2) underwent audiometric evaluation under the same test conditions, it is suggested that further studies be performed to increase the knowledge of the effects of high-intensity music on the lower frequencies.
Regarding the thresholds at frequencies of 3000, 4000 and 6000Hz, which, when lowered, can disclose hearing loss due to exposure to high sound pressure levels; it should be emphasized that this study observed a difference, although not significant, between the mean conventional pure-tone air-conduction thresholds for the frequency of 6000Hz between G1 and G2, with a worse mean in G1 (Table 1). The presence of the audiometric notch, even if at only one frequency, should be seen as a warning sign, as it could suggest a trend of the onset of hearing loss.32
Still in relation to conventional audiometry, when comparing the right and left ears of G1, the results of this study showed worse results in the left ear for all frequencies (except for 4000Hz), disclosing asymmetry between the ears (Table 2).
Corroborating the present results, a study33 on the audiological profile of 40 symphonic orchestra musicians resulted in a profile that follows the pattern of MIHL evolution, but with asymmetric alteration between the ears, with the left ear as the most affected. Two studies27,34 reported greater hearing loss in the left ear, both carried out with violinists. However, the present study included the participation of only two violin students.
Few studies have been reported in the literature on the use of high-frequency audiometry for evaluation of musicians and music students. In the present study, a significant difference between G1 and G2 was found, with worse results for G1 only at the frequency of 9000Hz in the right ear. However, the mean thresholds at 9000Hz in the left ear and at 10,000Hz and 11,200Hz in both ears were worse in G1 when compared to G2, although not statistically significant (Table 1).
These findings differ from those of another study,4 as although the author found mean thresholds of 11dB HL at most, there was the presence of a notch at the frequency of 12,500Hz bilaterally, and at the frequency of 14,000Hz in the right ear.
In another study,16 a notch was observed at the frequency of 11,200Hz in the left ear, 12,500Hz in the right ear, and 16,000Hz in both ears; these results also differ from those of the present study.
Conversely, one study35 evaluated the temporary change in threshold at 500–14,000Hz in 16 non-professional musicians before and after 90min of practice. All had experienced repeated exposures to intense sound levels for at least five years during their musical careers. The evaluation performed after the practice showed the lowest thresholds for frequencies from 500Hz to 8000Hz (p<0.004), with worse results for the frequency of 6000Hz, but there were no differences in the frequencies of 9000–14,000Hz. The authors concluded, based on these results, that high-frequency audiometry does not appear to be advantageous as a means of early detection of hearing loss induced by high-intensity levels of music.
When analyzed according to age, for G1 up to 25 years (Table 4), although there was a significant difference only at frequencies of 250Hz in the left ear and 500Hz in both ears, the left ear in group G1 also showed the worst mean thresholds at frequencies 2000Hz, 6000Hz, 9000Hz, 10,000Hz and 11,200Hz, when compared to G2.
For G1 of 26 years and older, there was a significant difference only at the frequency of 250Hz in both ears and 500Hz in the left ear. However, the mean thresholds of G1 were also worse than G2 at the frequencies of 2000Hz, 3000Hz, 4000Hz, 6000Hz, 8000Hz, 9000Hz, 10,000Hz and 11,200Hz in the left ear; and at 9000Hz, 10,000Hz and 11,200Hz in the right ear (Table 5).
Considering that the hearing loss induced by music or noise occurs after years of exposure and slowly progresses over time, the present study disclosed worse thresholds, although still within the normal range, for G1 at several frequencies, especially in the left ear for those older than 26 years, when compared to G2 (Tables 4 and 5).
The three institutions participating in this study offer music courses with a broad diversity of qualifications, which puts students in very diverse learning situations. Although common to all students, musical practice during training differs from course to course, depending on the institution and the qualification of choice and, in most cases, the student is not limited to just one musical instrument.
In this phase, the implementation of a hearing conservation program for this population could bring great benefits by providing students with all the necessary information on the risks of exposure to high-intensity music and how to prevent hearing loss.
In the present study, the audiometric findings, although mostly within the normal range, did not rule out possible early cochlear damage, which were perceived when appropriate comparisons were made, showing that the group of students (G1) exposed to music almost daily had worse pure-tone air conduction thresholds in the conventional audiometry and at high frequencies, especially in the left ear (Table 1).
High-frequency audiometry is a useful tool to detect early cochlear alterations. Despite the lack of standardized normality parameters and the fact that they are rarely performed in musicians, the differences in auditory thresholds at high frequencies, if followed for a longer period of time and also associated with conventional hearing thresholds, can provide information on the hearing status of musicians over the years.
The appearance of audiometric notches in both conventional and high-frequency audiometry could better clarify the effects of high-intensity music.
If this monitoring could be performed during the academic period, or even before graduation during the study of music in conservatories or music schools, the future musician would be much more prepared to face risk situations, and could collaborate to ensure that the sound intensities are neither strong enough nor of sufficient duration to result in hearing damage.
ConclusionBoth conventional and high-frequency audiometry disclosed statistically significant differences when comparing the audiometric thresholds of the music student group and the group consisting of non-musicians, non-music students, and those not exposed to noise at work, with the worst thresholds found in the group of music students. The most significant differences were found in the evaluation of high frequencies, which allows for the inference that sporadic high-frequency threshold assessment can be useful in early detection of hearing loss in musicians.
Conflicts of interestThe authors declare no conflicts of interest.
Please cite this article as: Lüders D, Gonçalves CG, Lacerda AB, Ribas Â, de Conto J. Music students: conventional hearing thresholds and at high frequencies. Braz J Otorhinolaryngol. 2014;80:296–304.


